Ukrainian vs Immigrants from Mexico Divorced or Separated
COMPARE
Ukrainian
Immigrants from Mexico
Divorced or Separated
Divorced or Separated Comparison
Ukrainians
Immigrants from Mexico
11.8%
DIVORCED OR SEPARATED
92.3/ 100
METRIC RATING
125th/ 347
METRIC RANK
12.0%
DIVORCED OR SEPARATED
53.2/ 100
METRIC RATING
172nd/ 347
METRIC RANK
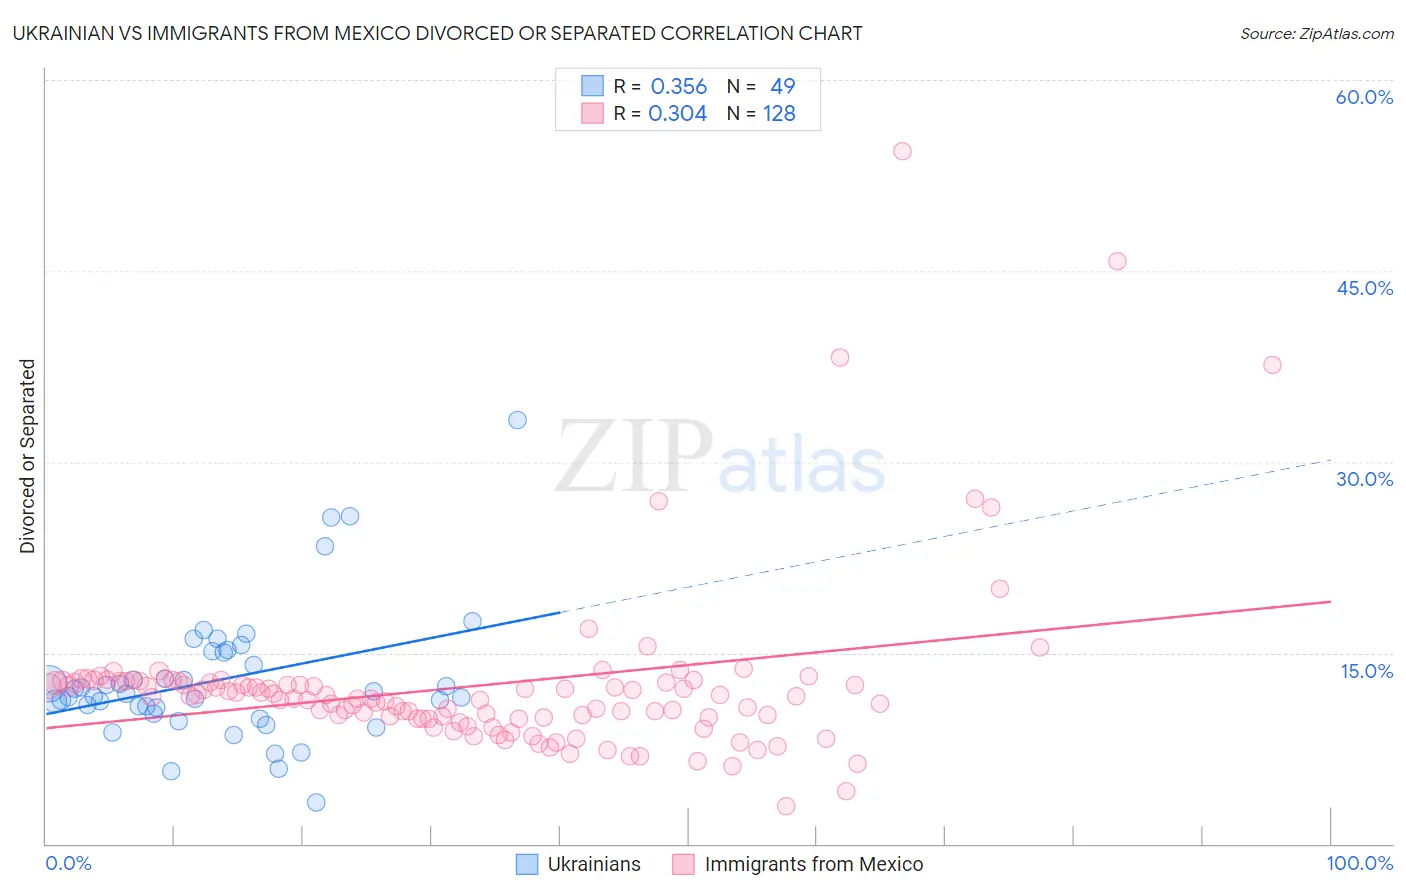
Ukrainian vs Immigrants from Mexico Divorced or Separated Correlation Chart
The statistical analysis conducted on geographies consisting of 448,426,688 people shows a mild positive correlation between the proportion of Ukrainians and percentage of population currently divorced or separated in the United States with a correlation coefficient (R) of 0.356 and weighted average of 11.8%. Similarly, the statistical analysis conducted on geographies consisting of 513,547,698 people shows a mild positive correlation between the proportion of Immigrants from Mexico and percentage of population currently divorced or separated in the United States with a correlation coefficient (R) of 0.304 and weighted average of 12.0%, a difference of 2.1%.
Divorced or Separated Correlation Summary
| Measurement | Ukrainian | Immigrants from Mexico |
| Minimum | 3.2% | 3.0% |
| Maximum | 33.3% | 54.4% |
| Range | 30.1% | 51.4% |
| Mean | 12.9% | 12.4% |
| Median | 11.7% | 11.5% |
| Interquartile 25% (IQ1) | 10.5% | 9.9% |
| Interquartile 75% (IQ3) | 15.1% | 12.7% |
| Interquartile Range (IQR) | 4.6% | 2.8% |
| Standard Deviation (Sample) | 5.3% | 6.7% |
| Standard Deviation (Population) | 5.2% | 6.7% |
Similar Demographics by Divorced or Separated
Demographics Similar to Ukrainians by Divorced or Separated
In terms of divorced or separated, the demographic groups most similar to Ukrainians are South American Indian (11.8%, a difference of 0.020%), Ugandan (11.8%, a difference of 0.11%), Immigrants (11.8%, a difference of 0.19%), Menominee (11.8%, a difference of 0.20%), and Romanian (11.8%, a difference of 0.32%).
| Demographics | Rating | Rank | Divorced or Separated |
| Ecuadorians | 95.3 /100 | #118 | Exceptional 11.7% |
| Syrians | 95.1 /100 | #119 | Exceptional 11.7% |
| Iraqis | 94.6 /100 | #120 | Exceptional 11.8% |
| Romanians | 94.5 /100 | #121 | Exceptional 11.8% |
| Menominee | 93.8 /100 | #122 | Exceptional 11.8% |
| Immigrants | Immigrants | 93.7 /100 | #123 | Exceptional 11.8% |
| Ugandans | 93.1 /100 | #124 | Exceptional 11.8% |
| Ukrainians | 92.3 /100 | #125 | Exceptional 11.8% |
| South American Indians | 92.1 /100 | #126 | Exceptional 11.8% |
| South Africans | 88.9 /100 | #127 | Excellent 11.8% |
| Immigrants | Ecuador | 88.9 /100 | #128 | Excellent 11.8% |
| Immigrants | St. Vincent and the Grenadines | 88.4 /100 | #129 | Excellent 11.8% |
| Immigrants | Austria | 88.2 /100 | #130 | Excellent 11.8% |
| Immigrants | Cambodia | 88.2 /100 | #131 | Excellent 11.8% |
| Immigrants | Afghanistan | 87.9 /100 | #132 | Excellent 11.8% |
Demographics Similar to Immigrants from Mexico by Divorced or Separated
In terms of divorced or separated, the demographic groups most similar to Immigrants from Mexico are Costa Rican (12.0%, a difference of 0.010%), Mexican American Indian (12.0%, a difference of 0.090%), Immigrants from Moldova (12.1%, a difference of 0.090%), Hawaiian (12.1%, a difference of 0.11%), and Immigrants from Sierra Leone (12.1%, a difference of 0.11%).
| Demographics | Rating | Rank | Divorced or Separated |
| German Russians | 61.8 /100 | #165 | Good 12.0% |
| Tohono O'odham | 60.4 /100 | #166 | Good 12.0% |
| Ethiopians | 58.5 /100 | #167 | Average 12.0% |
| Serbians | 57.1 /100 | #168 | Average 12.0% |
| Immigrants | Peru | 57.0 /100 | #169 | Average 12.0% |
| Mexican American Indians | 55.8 /100 | #170 | Average 12.0% |
| Costa Ricans | 53.3 /100 | #171 | Average 12.0% |
| Immigrants | Mexico | 53.2 /100 | #172 | Average 12.0% |
| Immigrants | Moldova | 50.4 /100 | #173 | Average 12.1% |
| Hawaiians | 50.0 /100 | #174 | Average 12.1% |
| Immigrants | Sierra Leone | 50.0 /100 | #175 | Average 12.1% |
| Pennsylvania Germans | 48.9 /100 | #176 | Average 12.1% |
| Brazilians | 47.7 /100 | #177 | Average 12.1% |
| Ghanaians | 45.9 /100 | #178 | Average 12.1% |
| Immigrants | Western Europe | 45.6 /100 | #179 | Average 12.1% |