Spanish American vs Arab Currently Married
COMPARE
Spanish American
Arab
Currently Married
Currently Married Comparison
Spanish Americans
Arabs
45.0%
CURRENTLY MARRIED
2.1/ 100
METRIC RATING
227th/ 347
METRIC RANK
47.0%
CURRENTLY MARRIED
68.6/ 100
METRIC RATING
155th/ 347
METRIC RANK
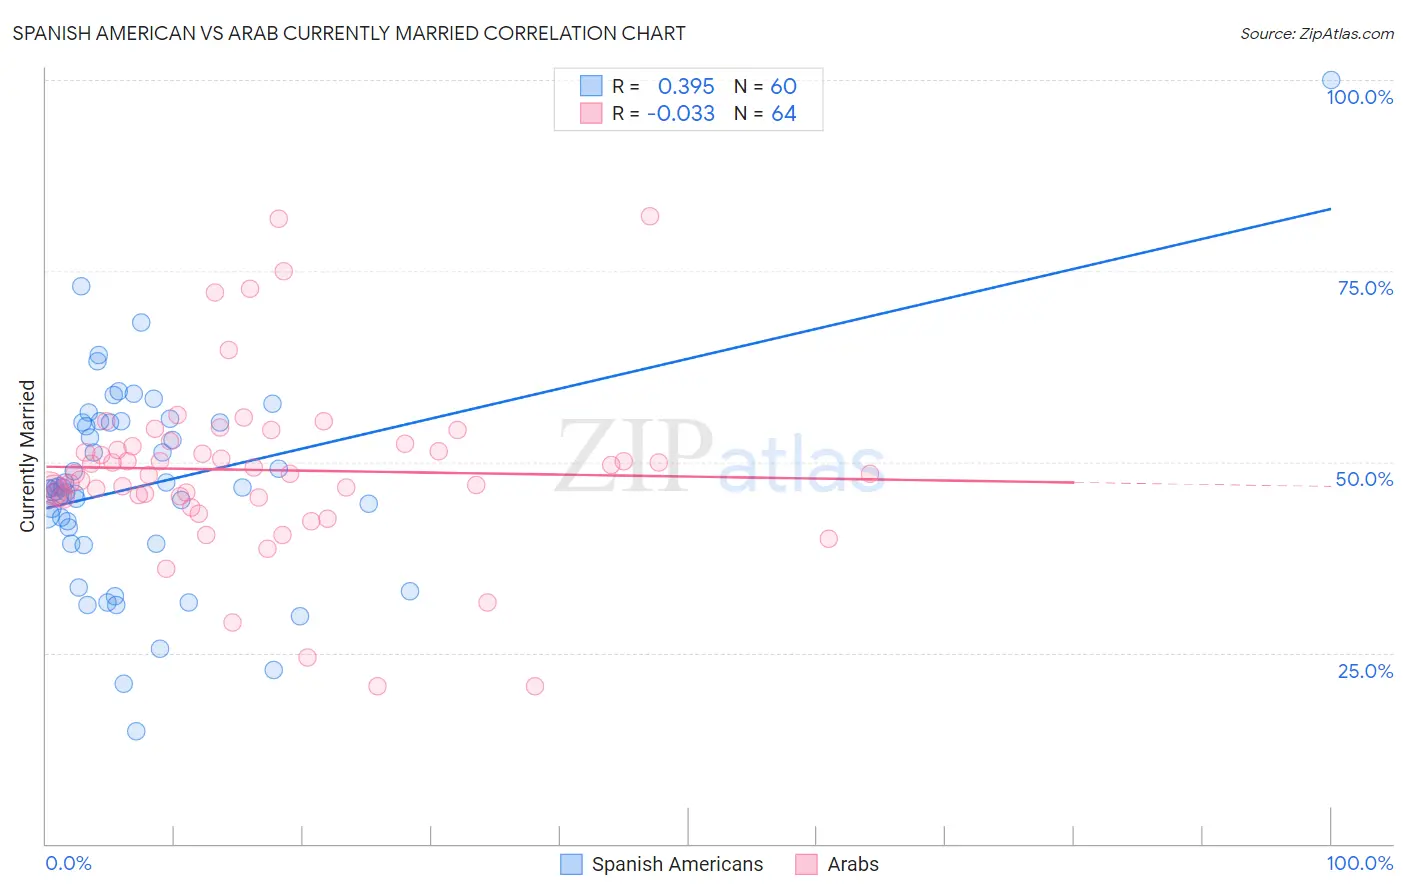
Spanish American vs Arab Currently Married Correlation Chart
The statistical analysis conducted on geographies consisting of 103,168,407 people shows a mild positive correlation between the proportion of Spanish Americans and percentage of population currently married in the United States with a correlation coefficient (R) of 0.395 and weighted average of 45.0%. Similarly, the statistical analysis conducted on geographies consisting of 486,767,077 people shows no correlation between the proportion of Arabs and percentage of population currently married in the United States with a correlation coefficient (R) of -0.033 and weighted average of 47.0%, a difference of 4.4%.
Currently Married Correlation Summary
| Measurement | Spanish American | Arab |
| Minimum | 14.8% | 20.6% |
| Maximum | 100.0% | 82.1% |
| Range | 85.2% | 61.5% |
| Mean | 47.0% | 48.9% |
| Median | 46.6% | 48.5% |
| Interquartile 25% (IQ1) | 40.4% | 45.4% |
| Interquartile 75% (IQ3) | 55.2% | 52.2% |
| Interquartile Range (IQR) | 14.8% | 6.7% |
| Standard Deviation (Sample) | 13.5% | 11.4% |
| Standard Deviation (Population) | 13.4% | 11.3% |
Similar Demographics by Currently Married
Demographics Similar to Spanish Americans by Currently Married
In terms of currently married, the demographic groups most similar to Spanish Americans are Comanche (45.0%, a difference of 0.0%), Immigrants from Uruguay (45.0%, a difference of 0.0%), French American Indian (45.0%, a difference of 0.050%), Immigrants from Uganda (45.0%, a difference of 0.060%), and Immigrants from Laos (45.0%, a difference of 0.10%).
| Demographics | Rating | Rank | Currently Married |
| Kenyans | 3.1 /100 | #220 | Tragic 45.2% |
| Mexicans | 3.0 /100 | #221 | Tragic 45.2% |
| Immigrants | Azores | 2.5 /100 | #222 | Tragic 45.1% |
| Immigrants | Laos | 2.3 /100 | #223 | Tragic 45.0% |
| Immigrants | Uganda | 2.2 /100 | #224 | Tragic 45.0% |
| French American Indians | 2.2 /100 | #225 | Tragic 45.0% |
| Comanche | 2.1 /100 | #226 | Tragic 45.0% |
| Spanish Americans | 2.1 /100 | #227 | Tragic 45.0% |
| Immigrants | Uruguay | 2.0 /100 | #228 | Tragic 45.0% |
| Cree | 1.7 /100 | #229 | Tragic 44.9% |
| Immigrants | Kenya | 1.6 /100 | #230 | Tragic 44.9% |
| Immigrants | Panama | 1.5 /100 | #231 | Tragic 44.9% |
| Nepalese | 1.2 /100 | #232 | Tragic 44.7% |
| Immigrants | Saudi Arabia | 1.1 /100 | #233 | Tragic 44.7% |
| Iroquois | 1.1 /100 | #234 | Tragic 44.7% |
Demographics Similar to Arabs by Currently Married
In terms of currently married, the demographic groups most similar to Arabs are Immigrants from Venezuela (47.0%, a difference of 0.0%), Albanian (47.0%, a difference of 0.0%), Immigrants from Serbia (47.0%, a difference of 0.010%), Spanish (47.0%, a difference of 0.020%), and Immigrants from Switzerland (46.9%, a difference of 0.030%).
| Demographics | Rating | Rank | Currently Married |
| Cambodians | 70.4 /100 | #148 | Good 47.0% |
| Zimbabweans | 70.1 /100 | #149 | Good 47.0% |
| Immigrants | Turkey | 70.0 /100 | #150 | Good 47.0% |
| Chileans | 69.8 /100 | #151 | Good 47.0% |
| Immigrants | Serbia | 68.8 /100 | #152 | Good 47.0% |
| Immigrants | Venezuela | 68.6 /100 | #153 | Good 47.0% |
| Albanians | 68.6 /100 | #154 | Good 47.0% |
| Arabs | 68.6 /100 | #155 | Good 47.0% |
| Spanish | 68.1 /100 | #156 | Good 47.0% |
| Immigrants | Switzerland | 67.8 /100 | #157 | Good 46.9% |
| Cherokee | 66.8 /100 | #158 | Good 46.9% |
| Iraqis | 66.4 /100 | #159 | Good 46.9% |
| Immigrants | Uzbekistan | 66.0 /100 | #160 | Good 46.9% |
| Immigrants | Southern Europe | 65.9 /100 | #161 | Good 46.9% |
| Immigrants | Nonimmigrants | 65.4 /100 | #162 | Good 46.9% |