Spanish American vs Filipino Currently Married
COMPARE
Spanish American
Filipino
Currently Married
Currently Married Comparison
Spanish Americans
Filipinos
45.0%
CURRENTLY MARRIED
2.1/ 100
METRIC RATING
227th/ 347
METRIC RANK
49.7%
CURRENTLY MARRIED
99.9/ 100
METRIC RATING
10th/ 347
METRIC RANK
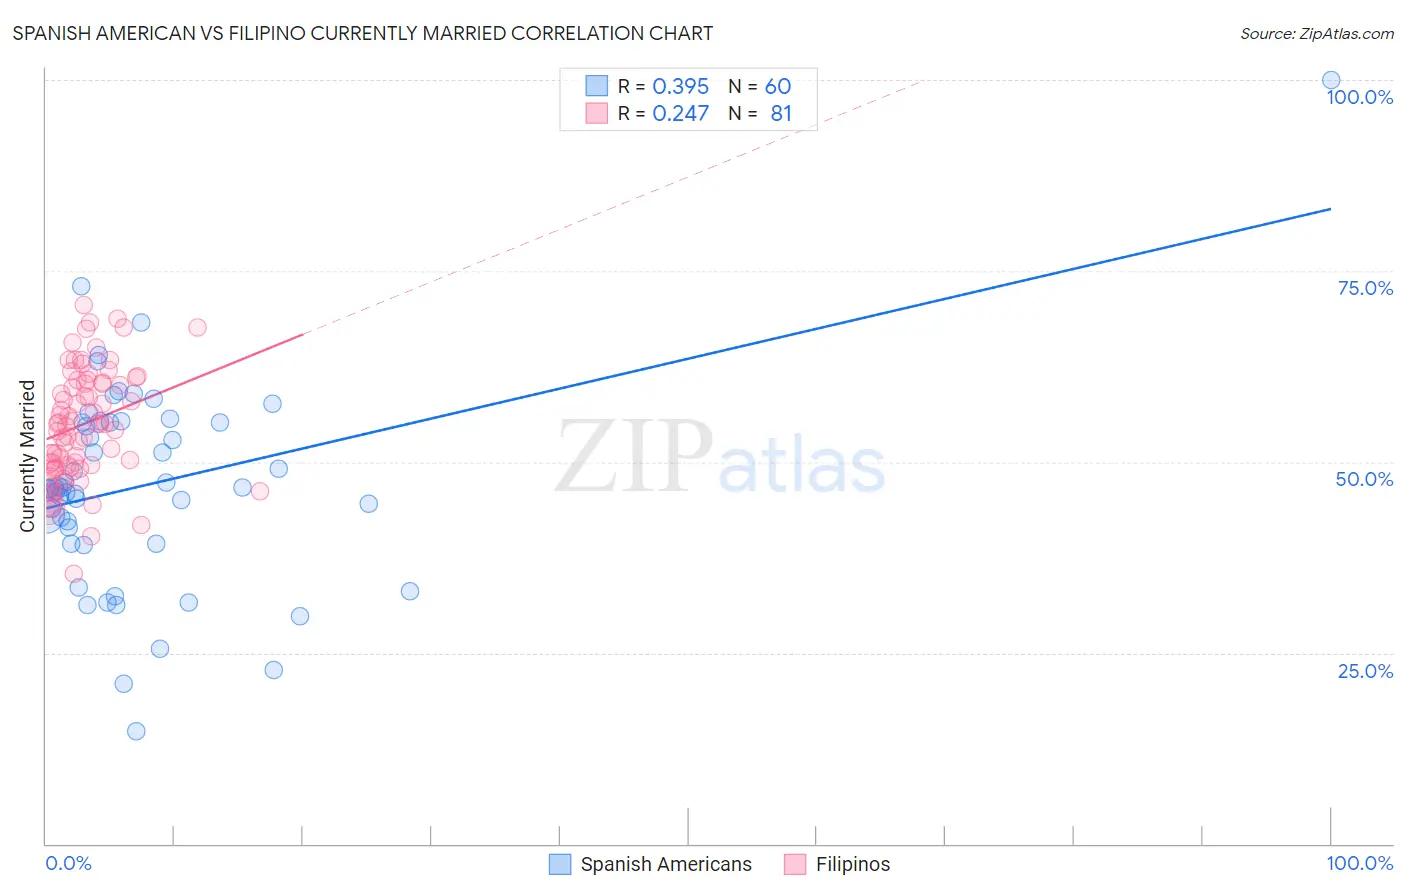
Spanish American vs Filipino Currently Married Correlation Chart
The statistical analysis conducted on geographies consisting of 103,168,407 people shows a mild positive correlation between the proportion of Spanish Americans and percentage of population currently married in the United States with a correlation coefficient (R) of 0.395 and weighted average of 45.0%. Similarly, the statistical analysis conducted on geographies consisting of 254,318,851 people shows a weak positive correlation between the proportion of Filipinos and percentage of population currently married in the United States with a correlation coefficient (R) of 0.247 and weighted average of 49.7%, a difference of 10.5%.
Currently Married Correlation Summary
| Measurement | Spanish American | Filipino |
| Minimum | 14.8% | 35.4% |
| Maximum | 100.0% | 70.6% |
| Range | 85.2% | 35.2% |
| Mean | 47.0% | 55.0% |
| Median | 46.6% | 55.0% |
| Interquartile 25% (IQ1) | 40.4% | 49.6% |
| Interquartile 75% (IQ3) | 55.2% | 60.6% |
| Interquartile Range (IQR) | 14.8% | 11.0% |
| Standard Deviation (Sample) | 13.5% | 7.3% |
| Standard Deviation (Population) | 13.4% | 7.2% |
Similar Demographics by Currently Married
Demographics Similar to Spanish Americans by Currently Married
In terms of currently married, the demographic groups most similar to Spanish Americans are Comanche (45.0%, a difference of 0.0%), Immigrants from Uruguay (45.0%, a difference of 0.0%), French American Indian (45.0%, a difference of 0.050%), Immigrants from Uganda (45.0%, a difference of 0.060%), and Immigrants from Laos (45.0%, a difference of 0.10%).
| Demographics | Rating | Rank | Currently Married |
| Kenyans | 3.1 /100 | #220 | Tragic 45.2% |
| Mexicans | 3.0 /100 | #221 | Tragic 45.2% |
| Immigrants | Azores | 2.5 /100 | #222 | Tragic 45.1% |
| Immigrants | Laos | 2.3 /100 | #223 | Tragic 45.0% |
| Immigrants | Uganda | 2.2 /100 | #224 | Tragic 45.0% |
| French American Indians | 2.2 /100 | #225 | Tragic 45.0% |
| Comanche | 2.1 /100 | #226 | Tragic 45.0% |
| Spanish Americans | 2.1 /100 | #227 | Tragic 45.0% |
| Immigrants | Uruguay | 2.0 /100 | #228 | Tragic 45.0% |
| Cree | 1.7 /100 | #229 | Tragic 44.9% |
| Immigrants | Kenya | 1.6 /100 | #230 | Tragic 44.9% |
| Immigrants | Panama | 1.5 /100 | #231 | Tragic 44.9% |
| Nepalese | 1.2 /100 | #232 | Tragic 44.7% |
| Immigrants | Saudi Arabia | 1.1 /100 | #233 | Tragic 44.7% |
| Iroquois | 1.1 /100 | #234 | Tragic 44.7% |
Demographics Similar to Filipinos by Currently Married
In terms of currently married, the demographic groups most similar to Filipinos are English (49.7%, a difference of 0.010%), Swiss (49.7%, a difference of 0.020%), Czech (49.9%, a difference of 0.26%), Dutch (49.6%, a difference of 0.28%), and German (49.6%, a difference of 0.29%).
| Demographics | Rating | Rank | Currently Married |
| Assyrians/Chaldeans/Syriacs | 100.0 /100 | #3 | Exceptional 50.8% |
| Immigrants | Taiwan | 100.0 /100 | #4 | Exceptional 50.7% |
| Danes | 100.0 /100 | #5 | Exceptional 50.5% |
| Norwegians | 100.0 /100 | #6 | Exceptional 50.2% |
| Immigrants | South Central Asia | 100.0 /100 | #7 | Exceptional 50.0% |
| Swedes | 100.0 /100 | #8 | Exceptional 50.0% |
| Czechs | 99.9 /100 | #9 | Exceptional 49.9% |
| Filipinos | 99.9 /100 | #10 | Exceptional 49.7% |
| English | 99.9 /100 | #11 | Exceptional 49.7% |
| Swiss | 99.9 /100 | #12 | Exceptional 49.7% |
| Dutch | 99.9 /100 | #13 | Exceptional 49.6% |
| Germans | 99.9 /100 | #14 | Exceptional 49.6% |
| Pennsylvania Germans | 99.9 /100 | #15 | Exceptional 49.6% |
| Chinese | 99.9 /100 | #16 | Exceptional 49.5% |
| Scandinavians | 99.9 /100 | #17 | Exceptional 49.5% |