Spanish American vs Trinidadian and Tobagonian Currently Married
COMPARE
Spanish American
Trinidadian and Tobagonian
Currently Married
Currently Married Comparison
Spanish Americans
Trinidadians and Tobagonians
45.0%
CURRENTLY MARRIED
2.1/ 100
METRIC RATING
227th/ 347
METRIC RANK
41.5%
CURRENTLY MARRIED
0.0/ 100
METRIC RATING
311th/ 347
METRIC RANK
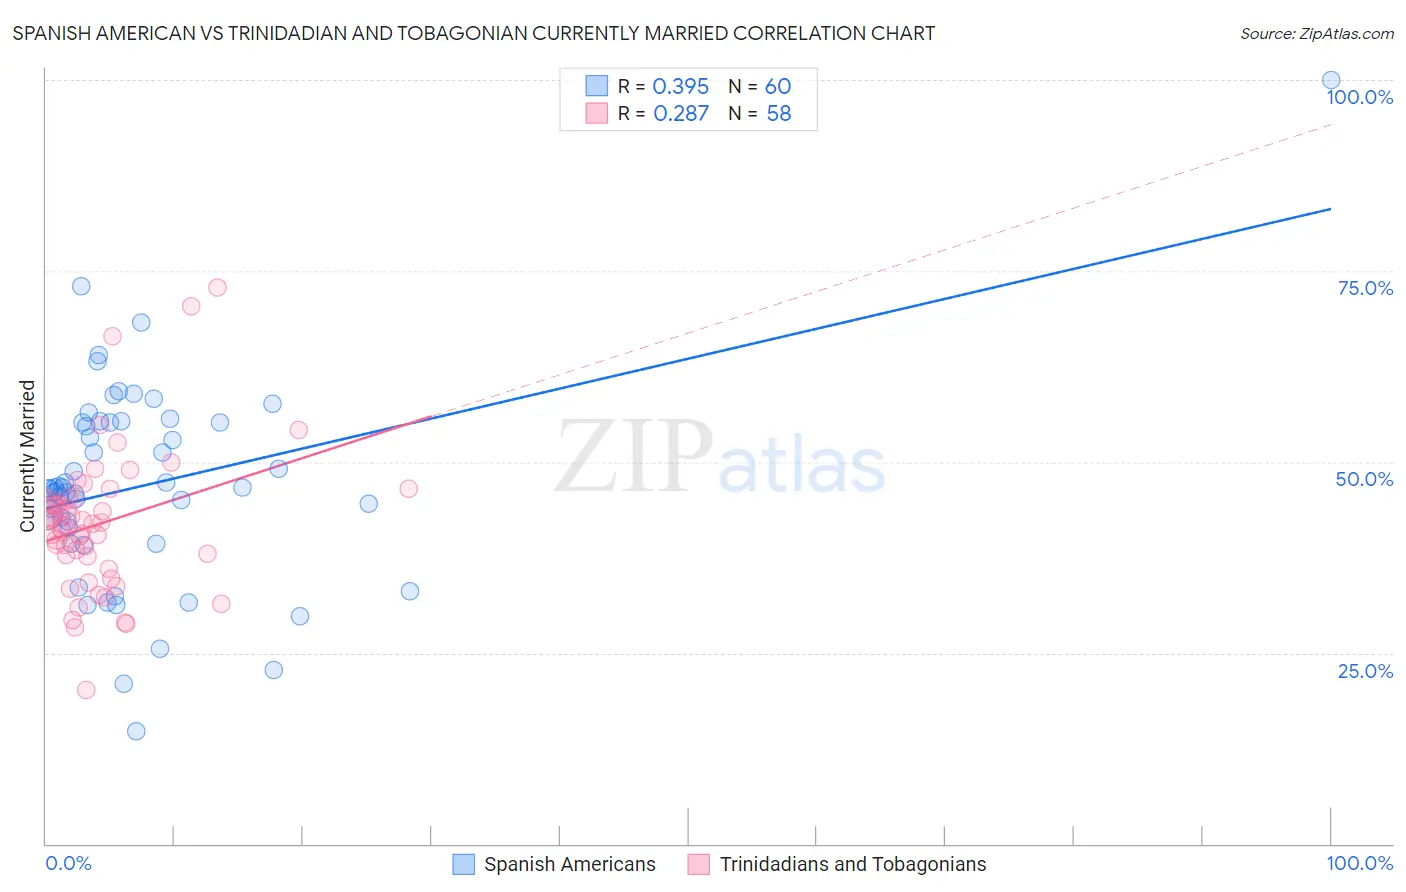
Spanish American vs Trinidadian and Tobagonian Currently Married Correlation Chart
The statistical analysis conducted on geographies consisting of 103,168,407 people shows a mild positive correlation between the proportion of Spanish Americans and percentage of population currently married in the United States with a correlation coefficient (R) of 0.395 and weighted average of 45.0%. Similarly, the statistical analysis conducted on geographies consisting of 219,846,005 people shows a weak positive correlation between the proportion of Trinidadians and Tobagonians and percentage of population currently married in the United States with a correlation coefficient (R) of 0.287 and weighted average of 41.5%, a difference of 8.3%.
Currently Married Correlation Summary
| Measurement | Spanish American | Trinidadian and Tobagonian |
| Minimum | 14.8% | 20.1% |
| Maximum | 100.0% | 72.9% |
| Range | 85.2% | 52.8% |
| Mean | 47.0% | 41.9% |
| Median | 46.6% | 41.8% |
| Interquartile 25% (IQ1) | 40.4% | 37.6% |
| Interquartile 75% (IQ3) | 55.2% | 45.0% |
| Interquartile Range (IQR) | 14.8% | 7.5% |
| Standard Deviation (Sample) | 13.5% | 9.4% |
| Standard Deviation (Population) | 13.4% | 9.4% |
Similar Demographics by Currently Married
Demographics Similar to Spanish Americans by Currently Married
In terms of currently married, the demographic groups most similar to Spanish Americans are Comanche (45.0%, a difference of 0.0%), Immigrants from Uruguay (45.0%, a difference of 0.0%), French American Indian (45.0%, a difference of 0.050%), Immigrants from Uganda (45.0%, a difference of 0.060%), and Immigrants from Laos (45.0%, a difference of 0.10%).
| Demographics | Rating | Rank | Currently Married |
| Kenyans | 3.1 /100 | #220 | Tragic 45.2% |
| Mexicans | 3.0 /100 | #221 | Tragic 45.2% |
| Immigrants | Azores | 2.5 /100 | #222 | Tragic 45.1% |
| Immigrants | Laos | 2.3 /100 | #223 | Tragic 45.0% |
| Immigrants | Uganda | 2.2 /100 | #224 | Tragic 45.0% |
| French American Indians | 2.2 /100 | #225 | Tragic 45.0% |
| Comanche | 2.1 /100 | #226 | Tragic 45.0% |
| Spanish Americans | 2.1 /100 | #227 | Tragic 45.0% |
| Immigrants | Uruguay | 2.0 /100 | #228 | Tragic 45.0% |
| Cree | 1.7 /100 | #229 | Tragic 44.9% |
| Immigrants | Kenya | 1.6 /100 | #230 | Tragic 44.9% |
| Immigrants | Panama | 1.5 /100 | #231 | Tragic 44.9% |
| Nepalese | 1.2 /100 | #232 | Tragic 44.7% |
| Immigrants | Saudi Arabia | 1.1 /100 | #233 | Tragic 44.7% |
| Iroquois | 1.1 /100 | #234 | Tragic 44.7% |
Demographics Similar to Trinidadians and Tobagonians by Currently Married
In terms of currently married, the demographic groups most similar to Trinidadians and Tobagonians are Guyanese (41.6%, a difference of 0.15%), Somali (41.5%, a difference of 0.18%), Jamaican (41.4%, a difference of 0.47%), Immigrants from Liberia (41.8%, a difference of 0.51%), and West Indian (41.3%, a difference of 0.55%).
| Demographics | Rating | Rank | Currently Married |
| Immigrants | Bahamas | 0.0 /100 | #304 | Tragic 41.9% |
| Immigrants | Trinidad and Tobago | 0.0 /100 | #305 | Tragic 41.9% |
| Immigrants | Guyana | 0.0 /100 | #306 | Tragic 41.9% |
| Africans | 0.0 /100 | #307 | Tragic 41.8% |
| Immigrants | Belize | 0.0 /100 | #308 | Tragic 41.8% |
| Immigrants | Liberia | 0.0 /100 | #309 | Tragic 41.8% |
| Guyanese | 0.0 /100 | #310 | Tragic 41.6% |
| Trinidadians and Tobagonians | 0.0 /100 | #311 | Tragic 41.5% |
| Somalis | 0.0 /100 | #312 | Tragic 41.5% |
| Jamaicans | 0.0 /100 | #313 | Tragic 41.4% |
| West Indians | 0.0 /100 | #314 | Tragic 41.3% |
| Inupiat | 0.0 /100 | #315 | Tragic 41.3% |
| Immigrants | Caribbean | 0.0 /100 | #316 | Tragic 41.3% |
| Haitians | 0.0 /100 | #317 | Tragic 41.3% |
| Bahamians | 0.0 /100 | #318 | Tragic 41.2% |