Spanish American vs Ghanaian Currently Married
COMPARE
Spanish American
Ghanaian
Currently Married
Currently Married Comparison
Spanish Americans
Ghanaians
45.0%
CURRENTLY MARRIED
2.1/ 100
METRIC RATING
227th/ 347
METRIC RANK
42.9%
CURRENTLY MARRIED
0.0/ 100
METRIC RATING
286th/ 347
METRIC RANK
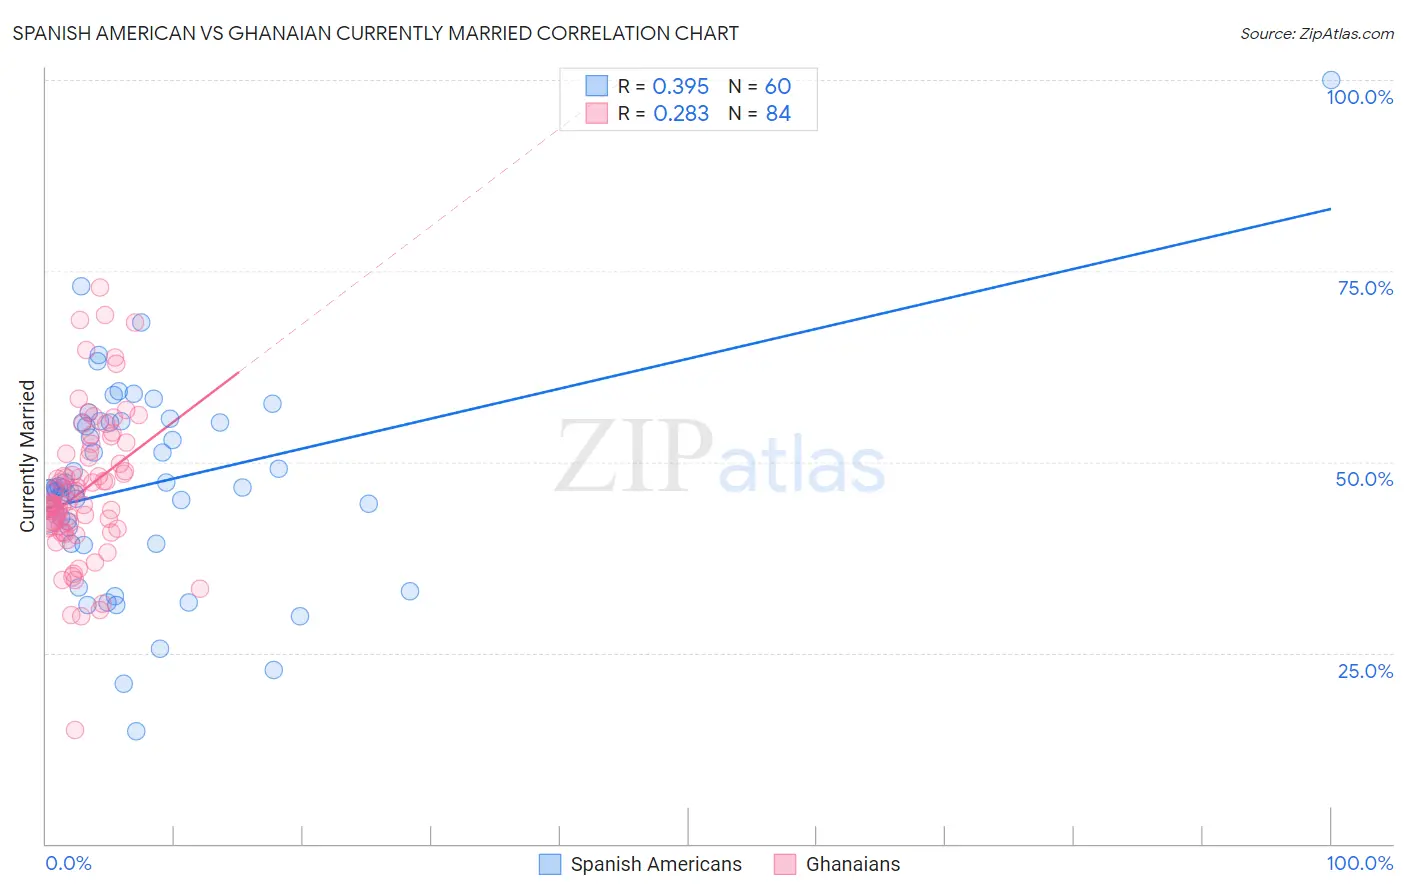
Spanish American vs Ghanaian Currently Married Correlation Chart
The statistical analysis conducted on geographies consisting of 103,168,407 people shows a mild positive correlation between the proportion of Spanish Americans and percentage of population currently married in the United States with a correlation coefficient (R) of 0.395 and weighted average of 45.0%. Similarly, the statistical analysis conducted on geographies consisting of 190,682,082 people shows a weak positive correlation between the proportion of Ghanaians and percentage of population currently married in the United States with a correlation coefficient (R) of 0.283 and weighted average of 42.9%, a difference of 4.8%.
Currently Married Correlation Summary
| Measurement | Spanish American | Ghanaian |
| Minimum | 14.8% | 14.9% |
| Maximum | 100.0% | 72.9% |
| Range | 85.2% | 58.0% |
| Mean | 47.0% | 46.3% |
| Median | 46.6% | 44.6% |
| Interquartile 25% (IQ1) | 40.4% | 41.5% |
| Interquartile 75% (IQ3) | 55.2% | 51.2% |
| Interquartile Range (IQR) | 14.8% | 9.8% |
| Standard Deviation (Sample) | 13.5% | 9.6% |
| Standard Deviation (Population) | 13.4% | 9.6% |
Similar Demographics by Currently Married
Demographics Similar to Spanish Americans by Currently Married
In terms of currently married, the demographic groups most similar to Spanish Americans are Comanche (45.0%, a difference of 0.0%), Immigrants from Uruguay (45.0%, a difference of 0.0%), French American Indian (45.0%, a difference of 0.050%), Immigrants from Uganda (45.0%, a difference of 0.060%), and Immigrants from Laos (45.0%, a difference of 0.10%).
| Demographics | Rating | Rank | Currently Married |
| Kenyans | 3.1 /100 | #220 | Tragic 45.2% |
| Mexicans | 3.0 /100 | #221 | Tragic 45.2% |
| Immigrants | Azores | 2.5 /100 | #222 | Tragic 45.1% |
| Immigrants | Laos | 2.3 /100 | #223 | Tragic 45.0% |
| Immigrants | Uganda | 2.2 /100 | #224 | Tragic 45.0% |
| French American Indians | 2.2 /100 | #225 | Tragic 45.0% |
| Comanche | 2.1 /100 | #226 | Tragic 45.0% |
| Spanish Americans | 2.1 /100 | #227 | Tragic 45.0% |
| Immigrants | Uruguay | 2.0 /100 | #228 | Tragic 45.0% |
| Cree | 1.7 /100 | #229 | Tragic 44.9% |
| Immigrants | Kenya | 1.6 /100 | #230 | Tragic 44.9% |
| Immigrants | Panama | 1.5 /100 | #231 | Tragic 44.9% |
| Nepalese | 1.2 /100 | #232 | Tragic 44.7% |
| Immigrants | Saudi Arabia | 1.1 /100 | #233 | Tragic 44.7% |
| Iroquois | 1.1 /100 | #234 | Tragic 44.7% |
Demographics Similar to Ghanaians by Currently Married
In terms of currently married, the demographic groups most similar to Ghanaians are Guatemalan (42.9%, a difference of 0.020%), Immigrants from Middle Africa (43.0%, a difference of 0.13%), Native/Alaskan (42.8%, a difference of 0.29%), Paiute (42.7%, a difference of 0.52%), and Immigrants from El Salvador (43.1%, a difference of 0.53%).
| Demographics | Rating | Rank | Currently Married |
| Central American Indians | 0.0 /100 | #279 | Tragic 43.3% |
| Apache | 0.0 /100 | #280 | Tragic 43.2% |
| Chippewa | 0.0 /100 | #281 | Tragic 43.2% |
| Immigrants | Ecuador | 0.0 /100 | #282 | Tragic 43.2% |
| Kiowa | 0.0 /100 | #283 | Tragic 43.2% |
| Immigrants | El Salvador | 0.0 /100 | #284 | Tragic 43.1% |
| Immigrants | Middle Africa | 0.0 /100 | #285 | Tragic 43.0% |
| Ghanaians | 0.0 /100 | #286 | Tragic 42.9% |
| Guatemalans | 0.0 /100 | #287 | Tragic 42.9% |
| Natives/Alaskans | 0.0 /100 | #288 | Tragic 42.8% |
| Paiute | 0.0 /100 | #289 | Tragic 42.7% |
| Immigrants | Ghana | 0.0 /100 | #290 | Tragic 42.7% |
| Immigrants | Guatemala | 0.0 /100 | #291 | Tragic 42.6% |
| Sub-Saharan Africans | 0.0 /100 | #292 | Tragic 42.6% |
| Yuman | 0.0 /100 | #293 | Tragic 42.6% |