Spaniard vs Apache Average Family Size
COMPARE
Spaniard
Apache
Average Family Size
Average Family Size Comparison
Spaniards
Apache
3.23
AVERAGE FAMILY SIZE
47.2/ 100
METRIC RATING
178th/ 347
METRIC RANK
3.46
AVERAGE FAMILY SIZE
100.0/ 100
METRIC RATING
22nd/ 347
METRIC RANK
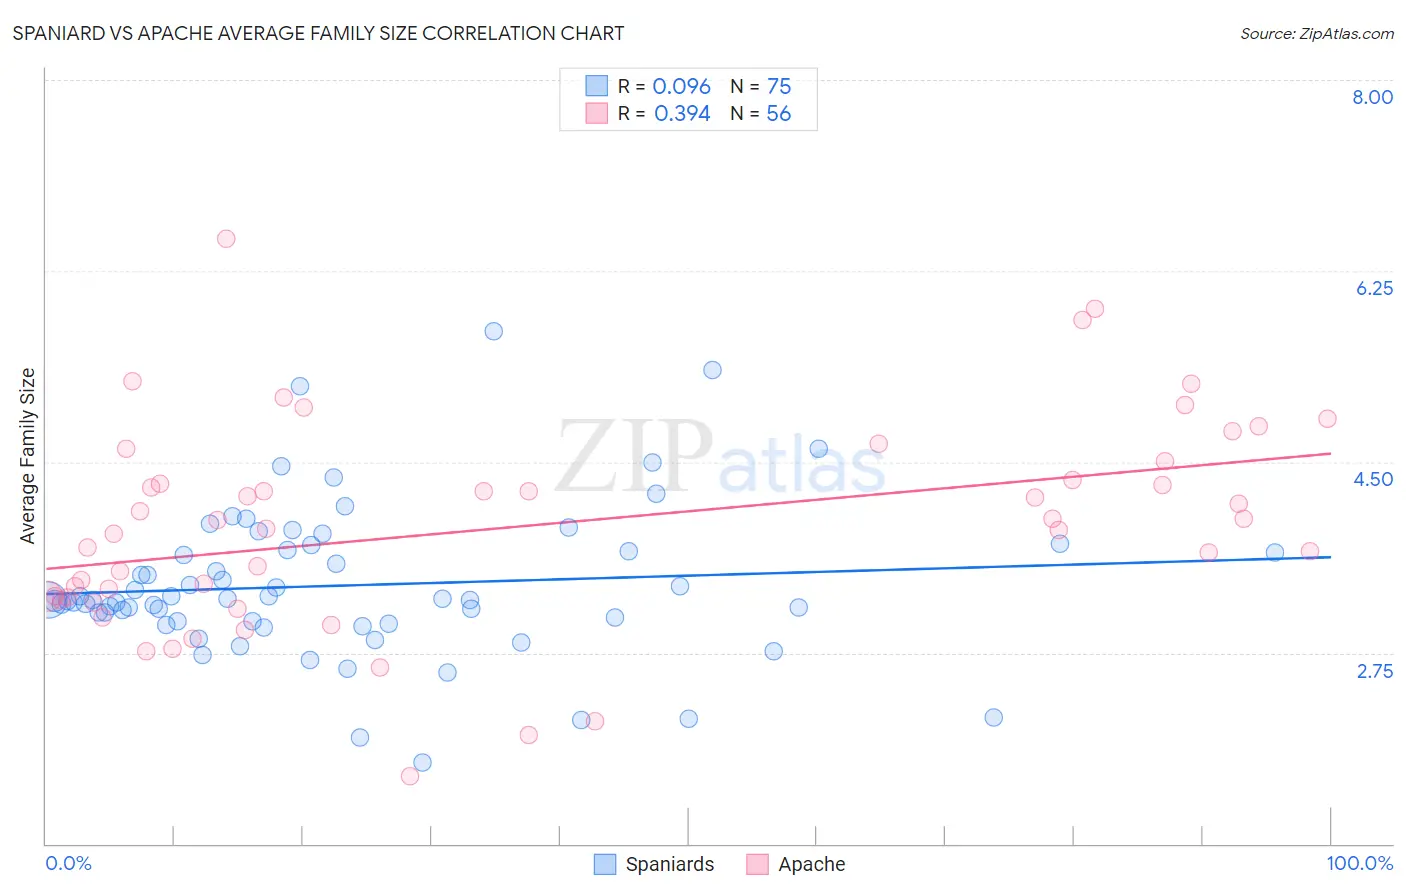
Spaniard vs Apache Average Family Size Correlation Chart
The statistical analysis conducted on geographies consisting of 443,170,080 people shows a slight positive correlation between the proportion of Spaniards and average family size in the United States with a correlation coefficient (R) of 0.096 and weighted average of 3.23. Similarly, the statistical analysis conducted on geographies consisting of 231,040,944 people shows a mild positive correlation between the proportion of Apache and average family size in the United States with a correlation coefficient (R) of 0.394 and weighted average of 3.46, a difference of 7.3%.
Average Family Size Correlation Summary
| Measurement | Spaniard | Apache |
| Minimum | 1.74 | 1.62 |
| Maximum | 5.70 | 6.54 |
| Range | 3.96 | 4.92 |
| Mean | 3.37 | 3.91 |
| Median | 3.23 | 3.93 |
| Interquartile 25% (IQ1) | 3.04 | 3.27 |
| Interquartile 75% (IQ3) | 3.69 | 4.42 |
| Interquartile Range (IQR) | 0.66 | 1.15 |
| Standard Deviation (Sample) | 0.70 | 0.96 |
| Standard Deviation (Population) | 0.69 | 0.96 |
Similar Demographics by Average Family Size
Demographics Similar to Spaniards by Average Family Size
In terms of average family size, the demographic groups most similar to Spaniards are Argentinean (3.23, a difference of 0.0%), Immigrants from Korea (3.23, a difference of 0.010%), Palestinian (3.23, a difference of 0.010%), Israeli (3.23, a difference of 0.030%), and Spanish (3.23, a difference of 0.040%).
| Demographics | Rating | Rank | Average Family Size |
| Chileans | 53.2 /100 | #171 | Average 3.23 |
| Immigrants | Congo | 52.7 /100 | #172 | Average 3.23 |
| Immigrants | Uruguay | 52.0 /100 | #173 | Average 3.23 |
| Immigrants | South Central Asia | 50.0 /100 | #174 | Average 3.23 |
| Immigrants | China | 49.9 /100 | #175 | Average 3.23 |
| Israelis | 48.7 /100 | #176 | Average 3.23 |
| Argentineans | 47.4 /100 | #177 | Average 3.23 |
| Spaniards | 47.2 /100 | #178 | Average 3.23 |
| Immigrants | Korea | 46.9 /100 | #179 | Average 3.23 |
| Palestinians | 46.6 /100 | #180 | Average 3.23 |
| Spanish | 44.8 /100 | #181 | Average 3.23 |
| Moroccans | 44.2 /100 | #182 | Average 3.22 |
| Immigrants | Northern Africa | 41.7 /100 | #183 | Average 3.22 |
| Immigrants | Eastern Asia | 40.8 /100 | #184 | Average 3.22 |
| Immigrants | Sri Lanka | 39.8 /100 | #185 | Fair 3.22 |
Demographics Similar to Apache by Average Family Size
In terms of average family size, the demographic groups most similar to Apache are Yuman (3.47, a difference of 0.060%), Immigrants from Fiji (3.45, a difference of 0.29%), Cheyenne (3.47, a difference of 0.31%), Mexican (3.48, a difference of 0.35%), and Native/Alaskan (3.45, a difference of 0.41%).
| Demographics | Rating | Rank | Average Family Size |
| Tongans | 100.0 /100 | #15 | Exceptional 3.49 |
| Ute | 100.0 /100 | #16 | Exceptional 3.49 |
| Immigrants | El Salvador | 100.0 /100 | #17 | Exceptional 3.49 |
| Salvadorans | 100.0 /100 | #18 | Exceptional 3.48 |
| Mexicans | 100.0 /100 | #19 | Exceptional 3.48 |
| Cheyenne | 100.0 /100 | #20 | Exceptional 3.47 |
| Yuman | 100.0 /100 | #21 | Exceptional 3.47 |
| Apache | 100.0 /100 | #22 | Exceptional 3.46 |
| Immigrants | Fiji | 100.0 /100 | #23 | Exceptional 3.45 |
| Natives/Alaskans | 100.0 /100 | #24 | Exceptional 3.45 |
| Yakama | 100.0 /100 | #25 | Exceptional 3.45 |
| Native Hawaiians | 100.0 /100 | #26 | Exceptional 3.43 |
| Mexican American Indians | 100.0 /100 | #27 | Exceptional 3.43 |
| Immigrants | Latin America | 100.0 /100 | #28 | Exceptional 3.42 |
| Nepalese | 100.0 /100 | #29 | Exceptional 3.42 |