Spaniard vs Immigrants from Eastern Asia Average Family Size
COMPARE
Spaniard
Immigrants from Eastern Asia
Average Family Size
Average Family Size Comparison
Spaniards
Immigrants from Eastern Asia
3.23
AVERAGE FAMILY SIZE
47.2/ 100
METRIC RATING
178th/ 347
METRIC RANK
3.22
AVERAGE FAMILY SIZE
40.8/ 100
METRIC RATING
184th/ 347
METRIC RANK
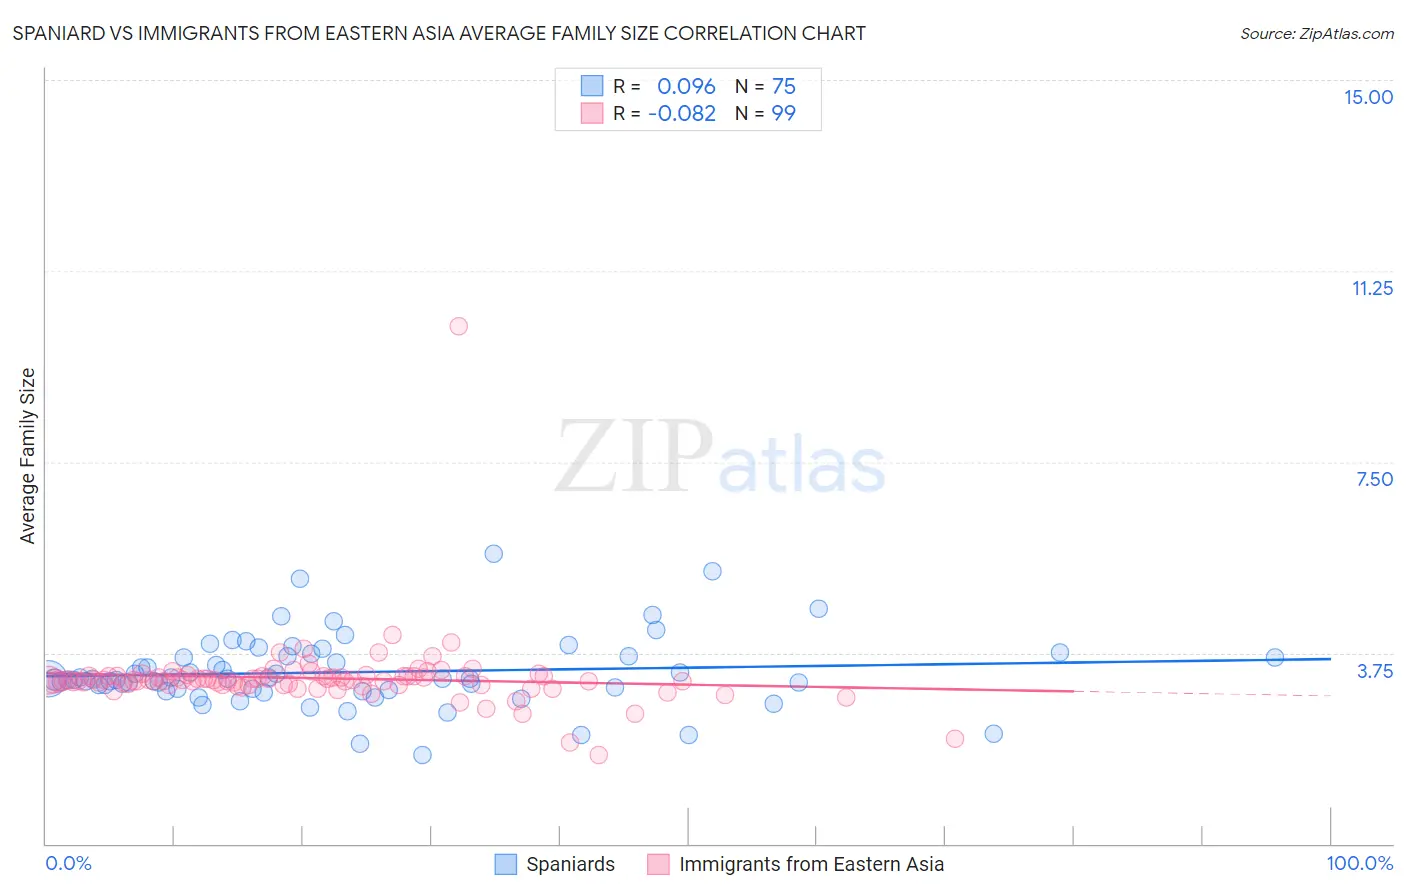
Spaniard vs Immigrants from Eastern Asia Average Family Size Correlation Chart
The statistical analysis conducted on geographies consisting of 443,170,080 people shows a slight positive correlation between the proportion of Spaniards and average family size in the United States with a correlation coefficient (R) of 0.096 and weighted average of 3.23. Similarly, the statistical analysis conducted on geographies consisting of 499,398,667 people shows a slight negative correlation between the proportion of Immigrants from Eastern Asia and average family size in the United States with a correlation coefficient (R) of -0.082 and weighted average of 3.22, a difference of 0.12%.
Average Family Size Correlation Summary
| Measurement | Spaniard | Immigrants from Eastern Asia |
| Minimum | 1.74 | 1.75 |
| Maximum | 5.70 | 10.17 |
| Range | 3.96 | 8.42 |
| Mean | 3.37 | 3.25 |
| Median | 3.23 | 3.21 |
| Interquartile 25% (IQ1) | 3.04 | 3.12 |
| Interquartile 75% (IQ3) | 3.69 | 3.29 |
| Interquartile Range (IQR) | 0.66 | 0.17 |
| Standard Deviation (Sample) | 0.70 | 0.77 |
| Standard Deviation (Population) | 0.69 | 0.77 |
Demographics Similar to Spaniards and Immigrants from Eastern Asia by Average Family Size
In terms of average family size, the demographic groups most similar to Spaniards are Argentinean (3.23, a difference of 0.0%), Immigrants from Korea (3.23, a difference of 0.010%), Palestinian (3.23, a difference of 0.010%), Israeli (3.23, a difference of 0.030%), and Spanish (3.23, a difference of 0.040%). Similarly, the demographic groups most similar to Immigrants from Eastern Asia are Immigrants from Northern Africa (3.22, a difference of 0.020%), Immigrants from Sri Lanka (3.22, a difference of 0.020%), Immigrants from Argentina (3.22, a difference of 0.020%), Immigrants from Malaysia (3.22, a difference of 0.030%), and Thai (3.22, a difference of 0.050%).
| Demographics | Rating | Rank | Average Family Size |
| Chileans | 53.2 /100 | #171 | Average 3.23 |
| Immigrants | Congo | 52.7 /100 | #172 | Average 3.23 |
| Immigrants | Uruguay | 52.0 /100 | #173 | Average 3.23 |
| Immigrants | South Central Asia | 50.0 /100 | #174 | Average 3.23 |
| Immigrants | China | 49.9 /100 | #175 | Average 3.23 |
| Israelis | 48.7 /100 | #176 | Average 3.23 |
| Argentineans | 47.4 /100 | #177 | Average 3.23 |
| Spaniards | 47.2 /100 | #178 | Average 3.23 |
| Immigrants | Korea | 46.9 /100 | #179 | Average 3.23 |
| Palestinians | 46.6 /100 | #180 | Average 3.23 |
| Spanish | 44.8 /100 | #181 | Average 3.23 |
| Moroccans | 44.2 /100 | #182 | Average 3.22 |
| Immigrants | Northern Africa | 41.7 /100 | #183 | Average 3.22 |
| Immigrants | Eastern Asia | 40.8 /100 | #184 | Average 3.22 |
| Immigrants | Sri Lanka | 39.8 /100 | #185 | Fair 3.22 |
| Immigrants | Argentina | 39.8 /100 | #186 | Fair 3.22 |
| Immigrants | Malaysia | 39.0 /100 | #187 | Fair 3.22 |
| Thais | 38.3 /100 | #188 | Fair 3.22 |
| Pakistanis | 33.7 /100 | #189 | Fair 3.22 |
| Burmese | 31.0 /100 | #190 | Fair 3.22 |
| Immigrants | Zaire | 30.5 /100 | #191 | Fair 3.22 |