Spaniard vs Immigrants from Ukraine Average Family Size
COMPARE
Spaniard
Immigrants from Ukraine
Average Family Size
Average Family Size Comparison
Spaniards
Immigrants from Ukraine
3.23
AVERAGE FAMILY SIZE
47.2/ 100
METRIC RATING
178th/ 347
METRIC RANK
3.19
AVERAGE FAMILY SIZE
7.2/ 100
METRIC RATING
221st/ 347
METRIC RANK
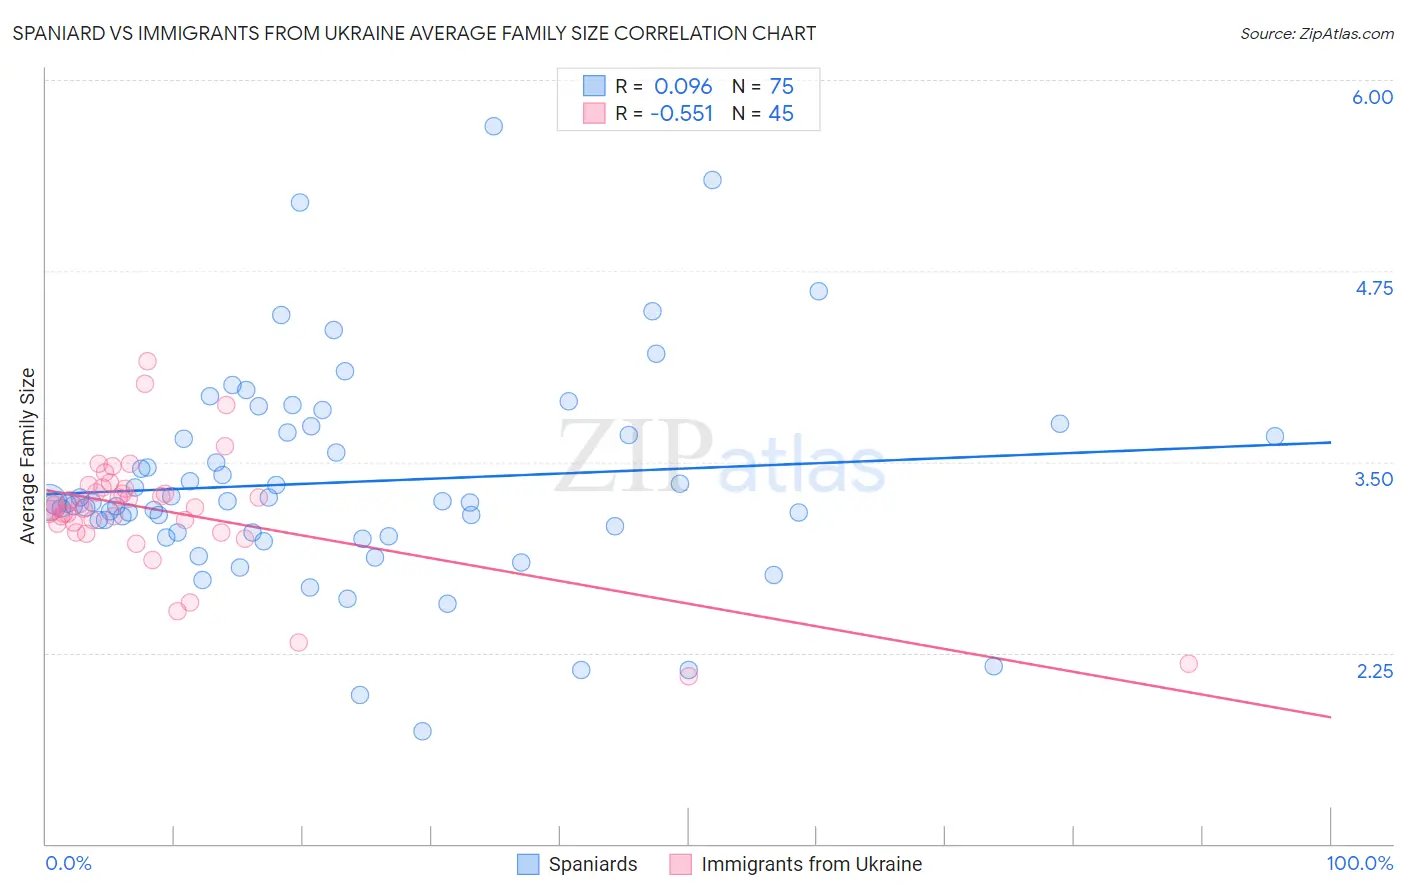
Spaniard vs Immigrants from Ukraine Average Family Size Correlation Chart
The statistical analysis conducted on geographies consisting of 443,170,080 people shows a slight positive correlation between the proportion of Spaniards and average family size in the United States with a correlation coefficient (R) of 0.096 and weighted average of 3.23. Similarly, the statistical analysis conducted on geographies consisting of 289,649,929 people shows a substantial negative correlation between the proportion of Immigrants from Ukraine and average family size in the United States with a correlation coefficient (R) of -0.551 and weighted average of 3.19, a difference of 1.1%.
Average Family Size Correlation Summary
| Measurement | Spaniard | Immigrants from Ukraine |
| Minimum | 1.74 | 2.10 |
| Maximum | 5.70 | 4.16 |
| Range | 3.96 | 2.06 |
| Mean | 3.37 | 3.18 |
| Median | 3.23 | 3.20 |
| Interquartile 25% (IQ1) | 3.04 | 3.07 |
| Interquartile 75% (IQ3) | 3.69 | 3.33 |
| Interquartile Range (IQR) | 0.66 | 0.26 |
| Standard Deviation (Sample) | 0.70 | 0.39 |
| Standard Deviation (Population) | 0.69 | 0.39 |
Similar Demographics by Average Family Size
Demographics Similar to Spaniards by Average Family Size
In terms of average family size, the demographic groups most similar to Spaniards are Argentinean (3.23, a difference of 0.0%), Immigrants from Korea (3.23, a difference of 0.010%), Palestinian (3.23, a difference of 0.010%), Israeli (3.23, a difference of 0.030%), and Spanish (3.23, a difference of 0.040%).
| Demographics | Rating | Rank | Average Family Size |
| Chileans | 53.2 /100 | #171 | Average 3.23 |
| Immigrants | Congo | 52.7 /100 | #172 | Average 3.23 |
| Immigrants | Uruguay | 52.0 /100 | #173 | Average 3.23 |
| Immigrants | South Central Asia | 50.0 /100 | #174 | Average 3.23 |
| Immigrants | China | 49.9 /100 | #175 | Average 3.23 |
| Israelis | 48.7 /100 | #176 | Average 3.23 |
| Argentineans | 47.4 /100 | #177 | Average 3.23 |
| Spaniards | 47.2 /100 | #178 | Average 3.23 |
| Immigrants | Korea | 46.9 /100 | #179 | Average 3.23 |
| Palestinians | 46.6 /100 | #180 | Average 3.23 |
| Spanish | 44.8 /100 | #181 | Average 3.23 |
| Moroccans | 44.2 /100 | #182 | Average 3.22 |
| Immigrants | Northern Africa | 41.7 /100 | #183 | Average 3.22 |
| Immigrants | Eastern Asia | 40.8 /100 | #184 | Average 3.22 |
| Immigrants | Sri Lanka | 39.8 /100 | #185 | Fair 3.22 |
Demographics Similar to Immigrants from Ukraine by Average Family Size
In terms of average family size, the demographic groups most similar to Immigrants from Ukraine are Immigrants from Kuwait (3.19, a difference of 0.0%), Immigrants from Zimbabwe (3.19, a difference of 0.010%), Syrian (3.19, a difference of 0.050%), Cree (3.19, a difference of 0.070%), and Chickasaw (3.19, a difference of 0.090%).
| Demographics | Rating | Rank | Average Family Size |
| Somalis | 11.2 /100 | #214 | Poor 3.20 |
| Delaware | 11.1 /100 | #215 | Poor 3.20 |
| Bermudans | 11.0 /100 | #216 | Poor 3.20 |
| Immigrants | Somalia | 10.3 /100 | #217 | Poor 3.20 |
| French American Indians | 9.8 /100 | #218 | Tragic 3.20 |
| Pennsylvania Germans | 9.3 /100 | #219 | Tragic 3.19 |
| Lebanese | 9.1 /100 | #220 | Tragic 3.19 |
| Immigrants | Ukraine | 7.2 /100 | #221 | Tragic 3.19 |
| Immigrants | Kuwait | 7.2 /100 | #222 | Tragic 3.19 |
| Immigrants | Zimbabwe | 7.1 /100 | #223 | Tragic 3.19 |
| Syrians | 6.5 /100 | #224 | Tragic 3.19 |
| Cree | 6.2 /100 | #225 | Tragic 3.19 |
| Chickasaw | 6.0 /100 | #226 | Tragic 3.19 |
| Portuguese | 6.0 /100 | #227 | Tragic 3.19 |
| Immigrants | Nonimmigrants | 5.7 /100 | #228 | Tragic 3.19 |