Spaniard vs Immigrants from India Average Family Size
COMPARE
Spaniard
Immigrants from India
Average Family Size
Average Family Size Comparison
Spaniards
Immigrants from India
3.23
AVERAGE FAMILY SIZE
47.2/ 100
METRIC RATING
178th/ 347
METRIC RANK
3.21
AVERAGE FAMILY SIZE
18.5/ 100
METRIC RATING
202nd/ 347
METRIC RANK
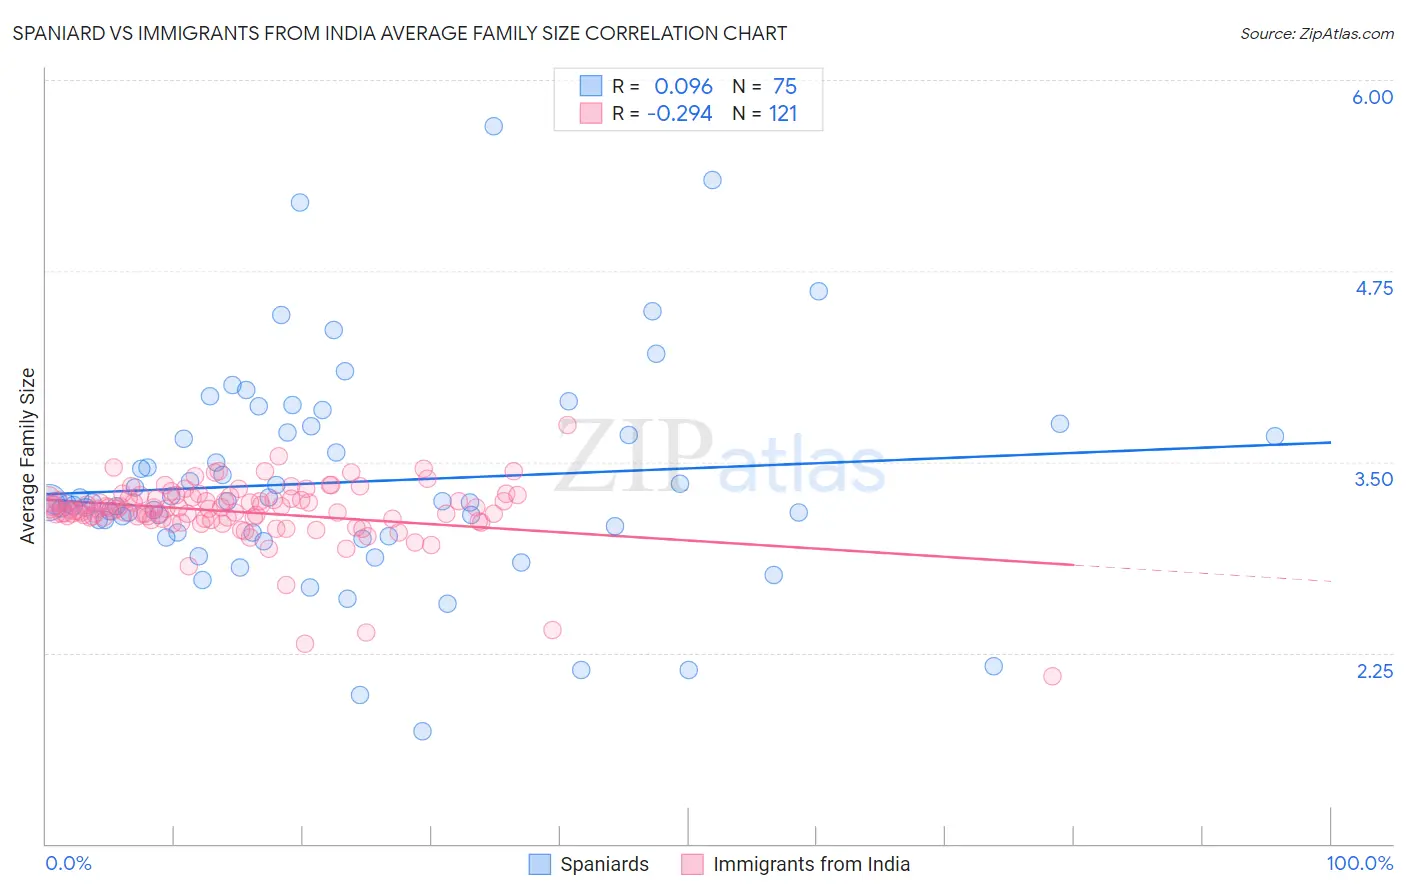
Spaniard vs Immigrants from India Average Family Size Correlation Chart
The statistical analysis conducted on geographies consisting of 443,170,080 people shows a slight positive correlation between the proportion of Spaniards and average family size in the United States with a correlation coefficient (R) of 0.096 and weighted average of 3.23. Similarly, the statistical analysis conducted on geographies consisting of 433,752,705 people shows a weak negative correlation between the proportion of Immigrants from India and average family size in the United States with a correlation coefficient (R) of -0.294 and weighted average of 3.21, a difference of 0.63%.
Average Family Size Correlation Summary
| Measurement | Spaniard | Immigrants from India |
| Minimum | 1.74 | 2.10 |
| Maximum | 5.70 | 3.74 |
| Range | 3.96 | 1.64 |
| Mean | 3.37 | 3.17 |
| Median | 3.23 | 3.19 |
| Interquartile 25% (IQ1) | 3.04 | 3.13 |
| Interquartile 75% (IQ3) | 3.69 | 3.26 |
| Interquartile Range (IQR) | 0.66 | 0.13 |
| Standard Deviation (Sample) | 0.70 | 0.21 |
| Standard Deviation (Population) | 0.69 | 0.21 |
Similar Demographics by Average Family Size
Demographics Similar to Spaniards by Average Family Size
In terms of average family size, the demographic groups most similar to Spaniards are Argentinean (3.23, a difference of 0.0%), Immigrants from Korea (3.23, a difference of 0.010%), Palestinian (3.23, a difference of 0.010%), Israeli (3.23, a difference of 0.030%), and Spanish (3.23, a difference of 0.040%).
| Demographics | Rating | Rank | Average Family Size |
| Chileans | 53.2 /100 | #171 | Average 3.23 |
| Immigrants | Congo | 52.7 /100 | #172 | Average 3.23 |
| Immigrants | Uruguay | 52.0 /100 | #173 | Average 3.23 |
| Immigrants | South Central Asia | 50.0 /100 | #174 | Average 3.23 |
| Immigrants | China | 49.9 /100 | #175 | Average 3.23 |
| Israelis | 48.7 /100 | #176 | Average 3.23 |
| Argentineans | 47.4 /100 | #177 | Average 3.23 |
| Spaniards | 47.2 /100 | #178 | Average 3.23 |
| Immigrants | Korea | 46.9 /100 | #179 | Average 3.23 |
| Palestinians | 46.6 /100 | #180 | Average 3.23 |
| Spanish | 44.8 /100 | #181 | Average 3.23 |
| Moroccans | 44.2 /100 | #182 | Average 3.22 |
| Immigrants | Northern Africa | 41.7 /100 | #183 | Average 3.22 |
| Immigrants | Eastern Asia | 40.8 /100 | #184 | Average 3.22 |
| Immigrants | Sri Lanka | 39.8 /100 | #185 | Fair 3.22 |
Demographics Similar to Immigrants from India by Average Family Size
In terms of average family size, the demographic groups most similar to Immigrants from India are Immigrants from Morocco (3.21, a difference of 0.0%), Immigrants from Nepal (3.21, a difference of 0.010%), Immigrants from Kenya (3.21, a difference of 0.020%), Immigrants from Poland (3.20, a difference of 0.060%), and Hmong (3.21, a difference of 0.070%).
| Demographics | Rating | Rank | Average Family Size |
| Choctaw | 28.3 /100 | #195 | Fair 3.21 |
| Senegalese | 28.2 /100 | #196 | Fair 3.21 |
| Kenyans | 28.0 /100 | #197 | Fair 3.21 |
| Immigrants | Azores | 21.7 /100 | #198 | Fair 3.21 |
| Hmong | 20.7 /100 | #199 | Fair 3.21 |
| Immigrants | Kenya | 19.2 /100 | #200 | Poor 3.21 |
| Immigrants | Morocco | 18.5 /100 | #201 | Poor 3.21 |
| Immigrants | India | 18.5 /100 | #202 | Poor 3.21 |
| Immigrants | Nepal | 18.1 /100 | #203 | Poor 3.21 |
| Immigrants | Poland | 16.6 /100 | #204 | Poor 3.20 |
| Paraguayans | 16.3 /100 | #205 | Poor 3.20 |
| Immigrants | Cabo Verde | 16.0 /100 | #206 | Poor 3.20 |
| Filipinos | 13.6 /100 | #207 | Poor 3.20 |
| Chippewa | 13.3 /100 | #208 | Poor 3.20 |
| Sudanese | 13.3 /100 | #209 | Poor 3.20 |