Spaniard vs Luxembourger Average Family Size
COMPARE
Spaniard
Luxembourger
Average Family Size
Average Family Size Comparison
Spaniards
Luxembourgers
3.23
AVERAGE FAMILY SIZE
47.2/ 100
METRIC RATING
178th/ 347
METRIC RANK
3.10
AVERAGE FAMILY SIZE
0.0/ 100
METRIC RATING
335th/ 347
METRIC RANK
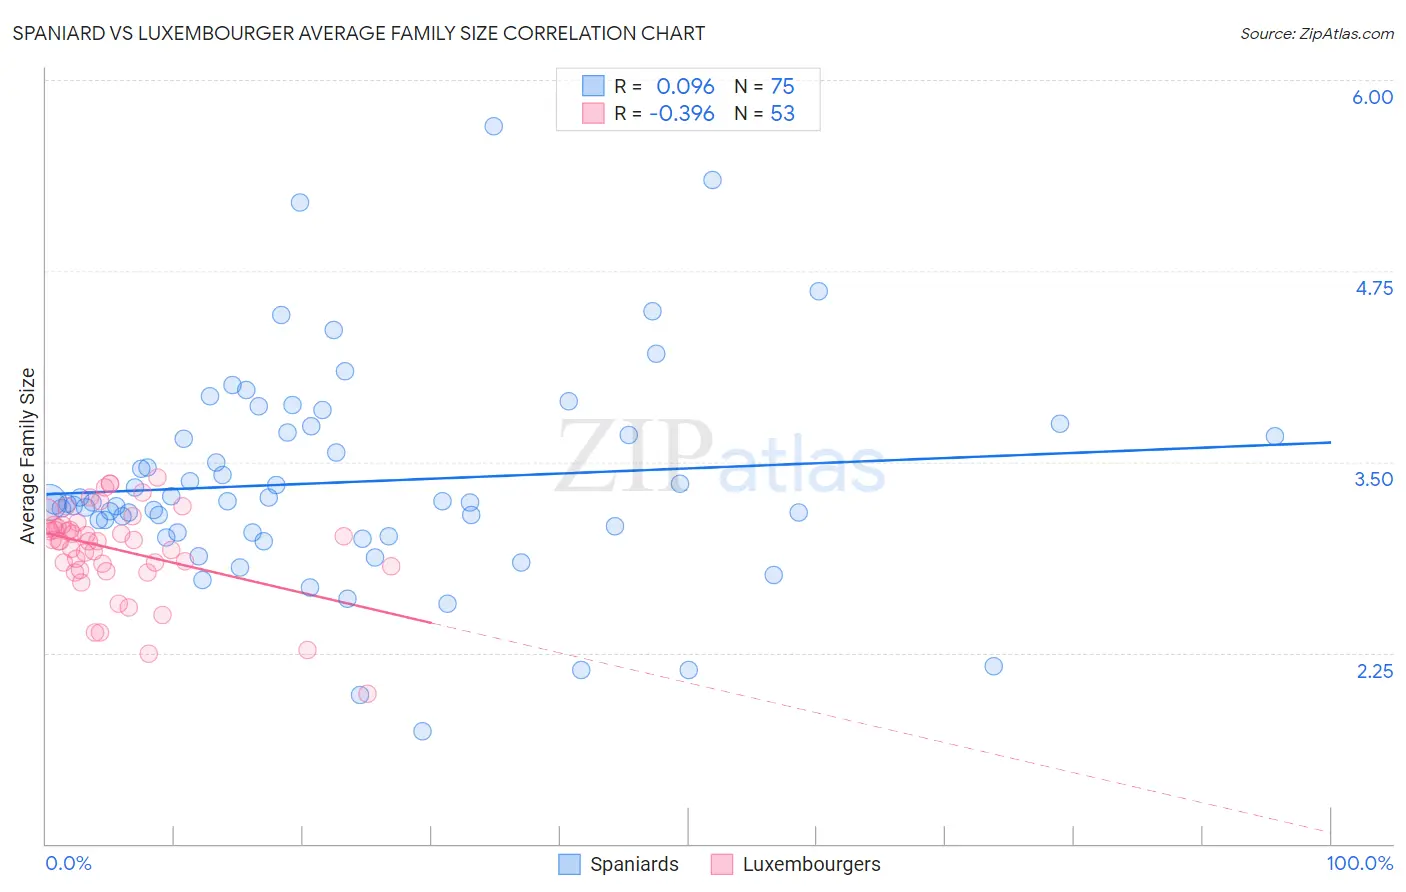
Spaniard vs Luxembourger Average Family Size Correlation Chart
The statistical analysis conducted on geographies consisting of 443,170,080 people shows a slight positive correlation between the proportion of Spaniards and average family size in the United States with a correlation coefficient (R) of 0.096 and weighted average of 3.23. Similarly, the statistical analysis conducted on geographies consisting of 144,654,567 people shows a mild negative correlation between the proportion of Luxembourgers and average family size in the United States with a correlation coefficient (R) of -0.396 and weighted average of 3.10, a difference of 4.0%.
Average Family Size Correlation Summary
| Measurement | Spaniard | Luxembourger |
| Minimum | 1.74 | 1.98 |
| Maximum | 5.70 | 3.40 |
| Range | 3.96 | 1.42 |
| Mean | 3.37 | 2.92 |
| Median | 3.23 | 2.98 |
| Interquartile 25% (IQ1) | 3.04 | 2.81 |
| Interquartile 75% (IQ3) | 3.69 | 3.09 |
| Interquartile Range (IQR) | 0.66 | 0.28 |
| Standard Deviation (Sample) | 0.70 | 0.30 |
| Standard Deviation (Population) | 0.69 | 0.30 |
Similar Demographics by Average Family Size
Demographics Similar to Spaniards by Average Family Size
In terms of average family size, the demographic groups most similar to Spaniards are Argentinean (3.23, a difference of 0.0%), Immigrants from Korea (3.23, a difference of 0.010%), Palestinian (3.23, a difference of 0.010%), Israeli (3.23, a difference of 0.030%), and Spanish (3.23, a difference of 0.040%).
| Demographics | Rating | Rank | Average Family Size |
| Chileans | 53.2 /100 | #171 | Average 3.23 |
| Immigrants | Congo | 52.7 /100 | #172 | Average 3.23 |
| Immigrants | Uruguay | 52.0 /100 | #173 | Average 3.23 |
| Immigrants | South Central Asia | 50.0 /100 | #174 | Average 3.23 |
| Immigrants | China | 49.9 /100 | #175 | Average 3.23 |
| Israelis | 48.7 /100 | #176 | Average 3.23 |
| Argentineans | 47.4 /100 | #177 | Average 3.23 |
| Spaniards | 47.2 /100 | #178 | Average 3.23 |
| Immigrants | Korea | 46.9 /100 | #179 | Average 3.23 |
| Palestinians | 46.6 /100 | #180 | Average 3.23 |
| Spanish | 44.8 /100 | #181 | Average 3.23 |
| Moroccans | 44.2 /100 | #182 | Average 3.22 |
| Immigrants | Northern Africa | 41.7 /100 | #183 | Average 3.22 |
| Immigrants | Eastern Asia | 40.8 /100 | #184 | Average 3.22 |
| Immigrants | Sri Lanka | 39.8 /100 | #185 | Fair 3.22 |
Demographics Similar to Luxembourgers by Average Family Size
In terms of average family size, the demographic groups most similar to Luxembourgers are Estonian (3.10, a difference of 0.030%), Lithuanian (3.10, a difference of 0.030%), Irish (3.10, a difference of 0.060%), Scotch-Irish (3.11, a difference of 0.080%), and Scottish (3.11, a difference of 0.080%).
| Demographics | Rating | Rank | Average Family Size |
| Czechs | 0.0 /100 | #328 | Tragic 3.11 |
| Belgians | 0.0 /100 | #329 | Tragic 3.11 |
| Latvians | 0.0 /100 | #330 | Tragic 3.11 |
| Scotch-Irish | 0.0 /100 | #331 | Tragic 3.11 |
| Scottish | 0.0 /100 | #332 | Tragic 3.11 |
| Estonians | 0.0 /100 | #333 | Tragic 3.10 |
| Lithuanians | 0.0 /100 | #334 | Tragic 3.10 |
| Luxembourgers | 0.0 /100 | #335 | Tragic 3.10 |
| Irish | 0.0 /100 | #336 | Tragic 3.10 |
| Swedes | 0.0 /100 | #337 | Tragic 3.10 |
| French | 0.0 /100 | #338 | Tragic 3.10 |
| Croatians | 0.0 /100 | #339 | Tragic 3.10 |
| Finns | 0.0 /100 | #340 | Tragic 3.09 |
| Poles | 0.0 /100 | #341 | Tragic 3.09 |
| Germans | 0.0 /100 | #342 | Tragic 3.09 |