Spaniard vs Immigrants from India Median Earnings
COMPARE
Spaniard
Immigrants from India
Median Earnings
Median Earnings Comparison
Spaniards
Immigrants from India
$46,059
MEDIAN EARNINGS
37.2/ 100
METRIC RATING
189th/ 347
METRIC RANK
$60,648
MEDIAN EARNINGS
100.0/ 100
METRIC RATING
3rd/ 347
METRIC RANK
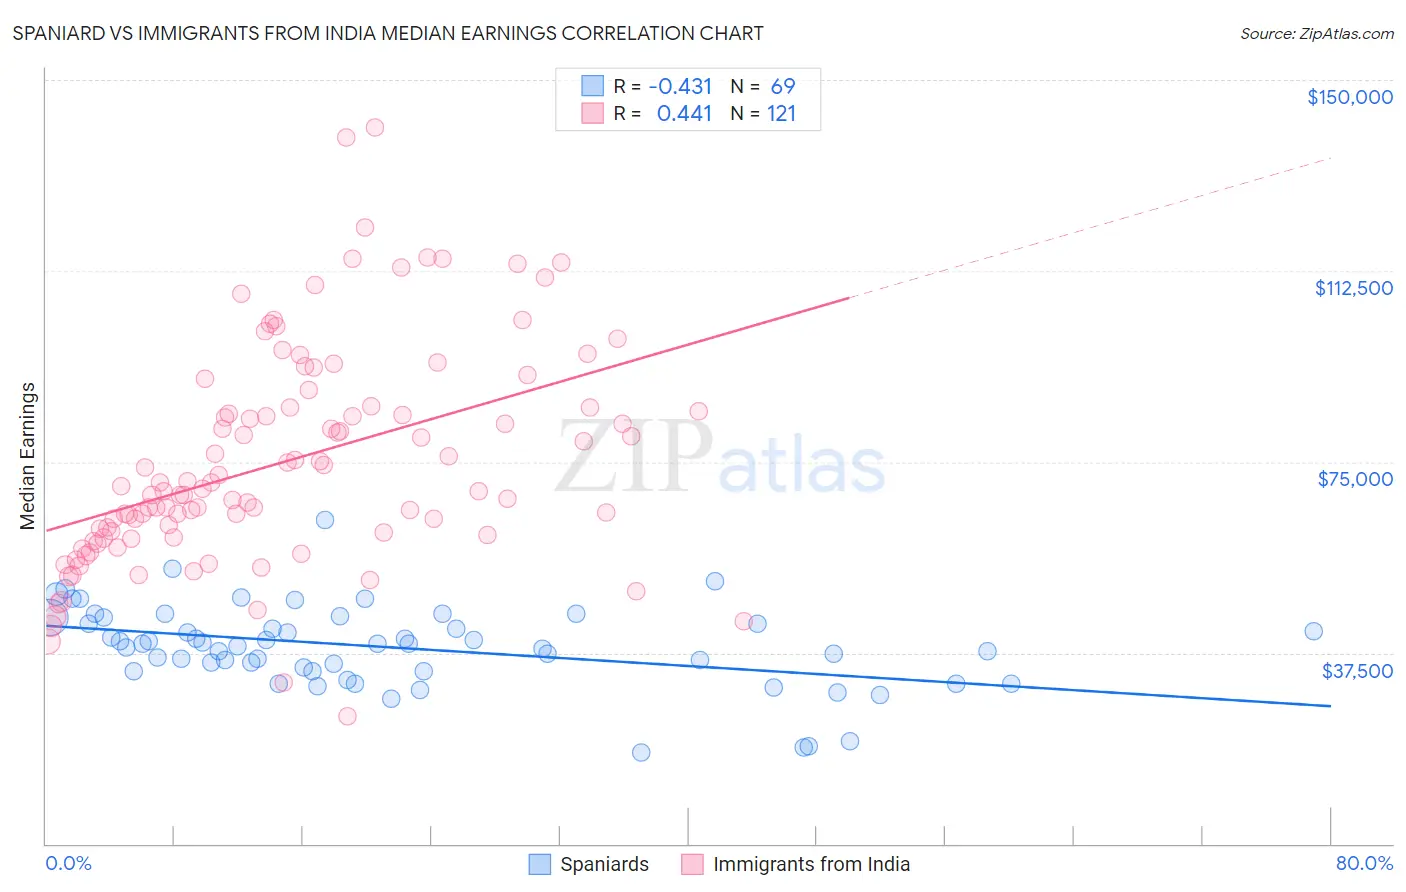
Spaniard vs Immigrants from India Median Earnings Correlation Chart
The statistical analysis conducted on geographies consisting of 443,499,083 people shows a moderate negative correlation between the proportion of Spaniards and median earnings in the United States with a correlation coefficient (R) of -0.431 and weighted average of $46,059. Similarly, the statistical analysis conducted on geographies consisting of 434,105,381 people shows a moderate positive correlation between the proportion of Immigrants from India and median earnings in the United States with a correlation coefficient (R) of 0.441 and weighted average of $60,648, a difference of 31.7%.
Median Earnings Correlation Summary
| Measurement | Spaniard | Immigrants from India |
| Minimum | $17,955 | $24,957 |
| Maximum | $63,593 | $140,742 |
| Range | $45,638 | $115,785 |
| Mean | $38,549 | $74,941 |
| Median | $39,160 | $69,769 |
| Interquartile 25% (IQ1) | $33,928 | $60,363 |
| Interquartile 75% (IQ3) | $43,838 | $85,753 |
| Interquartile Range (IQR) | $9,909 | $25,390 |
| Standard Deviation (Sample) | $8,136 | $21,309 |
| Standard Deviation (Population) | $8,076 | $21,220 |
Similar Demographics by Median Earnings
Demographics Similar to Spaniards by Median Earnings
In terms of median earnings, the demographic groups most similar to Spaniards are French Canadian ($46,026, a difference of 0.070%), Immigrants from Armenia ($46,094, a difference of 0.080%), Iraqi ($46,140, a difference of 0.18%), Vietnamese ($46,172, a difference of 0.24%), and Finnish ($45,940, a difference of 0.26%).
| Demographics | Rating | Rank | Median Earnings |
| Swiss | 45.9 /100 | #182 | Average $46,315 |
| French | 45.2 /100 | #183 | Average $46,296 |
| Immigrants | Kenya | 42.4 /100 | #184 | Average $46,214 |
| Uruguayans | 41.6 /100 | #185 | Average $46,190 |
| Vietnamese | 40.9 /100 | #186 | Average $46,172 |
| Iraqis | 39.9 /100 | #187 | Fair $46,140 |
| Immigrants | Armenia | 38.3 /100 | #188 | Fair $46,094 |
| Spaniards | 37.2 /100 | #189 | Fair $46,059 |
| French Canadians | 36.1 /100 | #190 | Fair $46,026 |
| Finns | 33.4 /100 | #191 | Fair $45,940 |
| Germans | 33.2 /100 | #192 | Fair $45,935 |
| Guamanians/Chamorros | 33.2 /100 | #193 | Fair $45,933 |
| Immigrants | Costa Rica | 33.0 /100 | #194 | Fair $45,928 |
| Immigrants | St. Vincent and the Grenadines | 32.4 /100 | #195 | Fair $45,908 |
| Yugoslavians | 30.5 /100 | #196 | Fair $45,846 |
Demographics Similar to Immigrants from India by Median Earnings
In terms of median earnings, the demographic groups most similar to Immigrants from India are Immigrants from Taiwan ($61,151, a difference of 0.83%), Filipino ($61,197, a difference of 0.91%), Immigrants from Hong Kong ($59,433, a difference of 2.0%), Thai ($59,237, a difference of 2.4%), and Immigrants from Singapore ($59,038, a difference of 2.7%).
| Demographics | Rating | Rank | Median Earnings |
| Filipinos | 100.0 /100 | #1 | Exceptional $61,197 |
| Immigrants | Taiwan | 100.0 /100 | #2 | Exceptional $61,151 |
| Immigrants | India | 100.0 /100 | #3 | Exceptional $60,648 |
| Immigrants | Hong Kong | 100.0 /100 | #4 | Exceptional $59,433 |
| Thais | 100.0 /100 | #5 | Exceptional $59,237 |
| Immigrants | Singapore | 100.0 /100 | #6 | Exceptional $59,038 |
| Iranians | 100.0 /100 | #7 | Exceptional $58,474 |
| Immigrants | Iran | 100.0 /100 | #8 | Exceptional $57,612 |
| Okinawans | 100.0 /100 | #9 | Exceptional $57,550 |
| Immigrants | South Central Asia | 100.0 /100 | #10 | Exceptional $57,114 |
| Immigrants | Israel | 100.0 /100 | #11 | Exceptional $57,034 |
| Immigrants | Ireland | 100.0 /100 | #12 | Exceptional $56,854 |
| Immigrants | China | 100.0 /100 | #13 | Exceptional $56,638 |
| Immigrants | Australia | 100.0 /100 | #14 | Exceptional $56,305 |
| Indians (Asian) | 100.0 /100 | #15 | Exceptional $56,253 |