Potawatomi vs Immigrants from India Average Family Size
COMPARE
Potawatomi
Immigrants from India
Average Family Size
Average Family Size Comparison
Potawatomi
Immigrants from India
3.16
AVERAGE FAMILY SIZE
1.3/ 100
METRIC RATING
259th/ 347
METRIC RANK
3.21
AVERAGE FAMILY SIZE
18.5/ 100
METRIC RATING
202nd/ 347
METRIC RANK
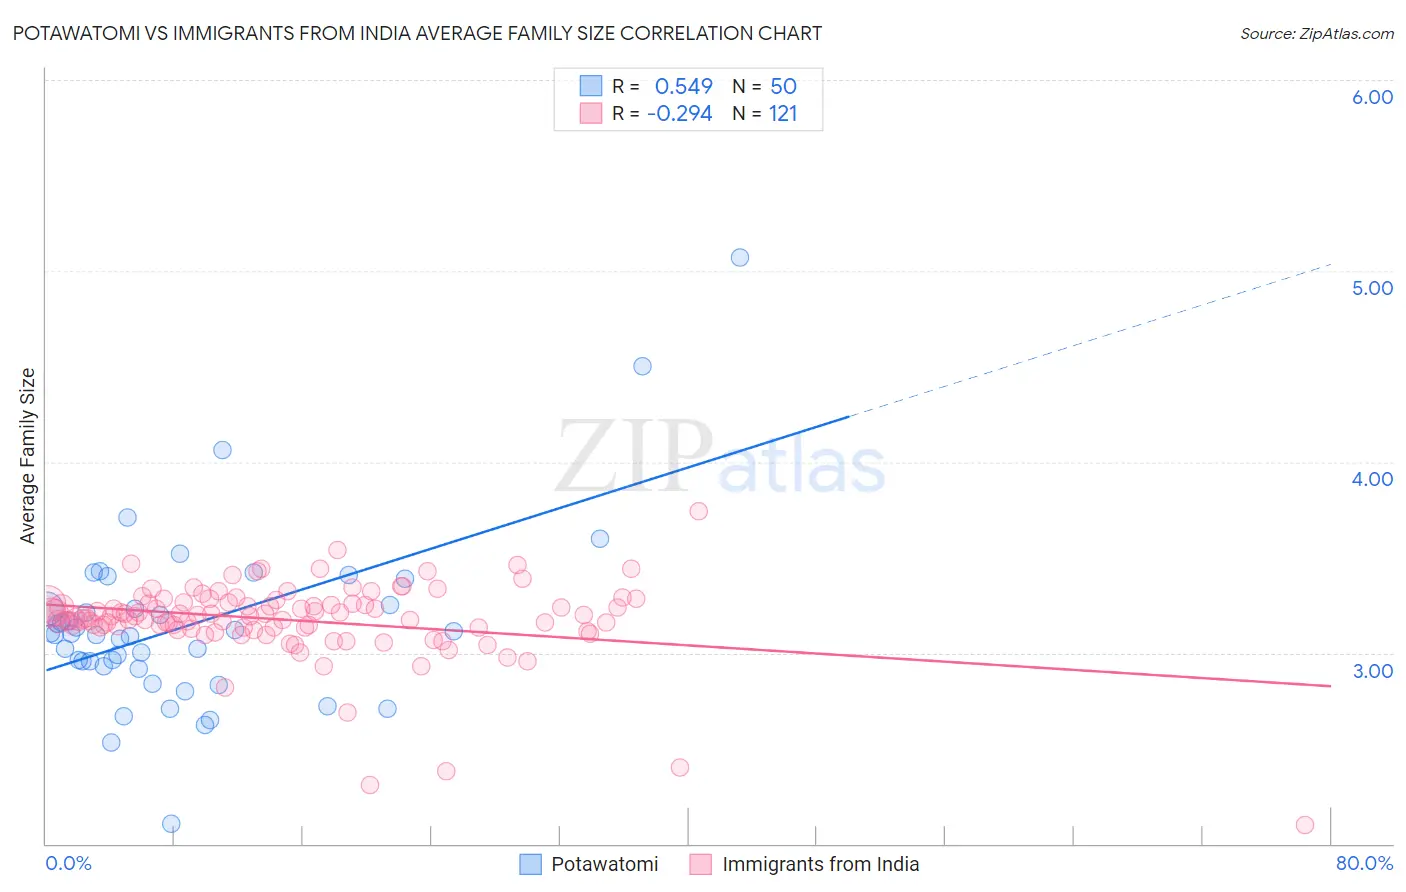
Potawatomi vs Immigrants from India Average Family Size Correlation Chart
The statistical analysis conducted on geographies consisting of 117,759,864 people shows a substantial positive correlation between the proportion of Potawatomi and average family size in the United States with a correlation coefficient (R) of 0.549 and weighted average of 3.16. Similarly, the statistical analysis conducted on geographies consisting of 433,752,705 people shows a weak negative correlation between the proportion of Immigrants from India and average family size in the United States with a correlation coefficient (R) of -0.294 and weighted average of 3.21, a difference of 1.3%.
Average Family Size Correlation Summary
| Measurement | Potawatomi | Immigrants from India |
| Minimum | 2.10 | 2.10 |
| Maximum | 5.07 | 3.74 |
| Range | 2.97 | 1.64 |
| Mean | 3.15 | 3.17 |
| Median | 3.10 | 3.19 |
| Interquartile 25% (IQ1) | 2.93 | 3.13 |
| Interquartile 75% (IQ3) | 3.25 | 3.26 |
| Interquartile Range (IQR) | 0.32 | 0.13 |
| Standard Deviation (Sample) | 0.47 | 0.21 |
| Standard Deviation (Population) | 0.47 | 0.21 |
Similar Demographics by Average Family Size
Demographics Similar to Potawatomi by Average Family Size
In terms of average family size, the demographic groups most similar to Potawatomi are Turkish (3.16, a difference of 0.0%), Immigrants from Albania (3.16, a difference of 0.0%), Immigrants from North Macedonia (3.16, a difference of 0.010%), Immigrants from Russia (3.16, a difference of 0.020%), and Albanian (3.17, a difference of 0.050%).
| Demographics | Rating | Rank | Average Family Size |
| Immigrants | Saudi Arabia | 1.7 /100 | #252 | Tragic 3.17 |
| South Africans | 1.7 /100 | #253 | Tragic 3.17 |
| Immigrants | Hungary | 1.7 /100 | #254 | Tragic 3.17 |
| Cape Verdeans | 1.6 /100 | #255 | Tragic 3.17 |
| Immigrants | Kazakhstan | 1.5 /100 | #256 | Tragic 3.17 |
| Albanians | 1.5 /100 | #257 | Tragic 3.17 |
| Turks | 1.3 /100 | #258 | Tragic 3.16 |
| Potawatomi | 1.3 /100 | #259 | Tragic 3.16 |
| Immigrants | Albania | 1.3 /100 | #260 | Tragic 3.16 |
| Immigrants | North Macedonia | 1.3 /100 | #261 | Tragic 3.16 |
| Immigrants | Russia | 1.3 /100 | #262 | Tragic 3.16 |
| Immigrants | Bulgaria | 1.0 /100 | #263 | Tragic 3.16 |
| Americans | 1.0 /100 | #264 | Tragic 3.16 |
| Immigrants | South Africa | 0.9 /100 | #265 | Tragic 3.16 |
| Immigrants | Greece | 0.9 /100 | #266 | Tragic 3.16 |
Demographics Similar to Immigrants from India by Average Family Size
In terms of average family size, the demographic groups most similar to Immigrants from India are Immigrants from Morocco (3.21, a difference of 0.0%), Immigrants from Nepal (3.21, a difference of 0.010%), Immigrants from Kenya (3.21, a difference of 0.020%), Immigrants from Poland (3.20, a difference of 0.060%), and Hmong (3.21, a difference of 0.070%).
| Demographics | Rating | Rank | Average Family Size |
| Choctaw | 28.3 /100 | #195 | Fair 3.21 |
| Senegalese | 28.2 /100 | #196 | Fair 3.21 |
| Kenyans | 28.0 /100 | #197 | Fair 3.21 |
| Immigrants | Azores | 21.7 /100 | #198 | Fair 3.21 |
| Hmong | 20.7 /100 | #199 | Fair 3.21 |
| Immigrants | Kenya | 19.2 /100 | #200 | Poor 3.21 |
| Immigrants | Morocco | 18.5 /100 | #201 | Poor 3.21 |
| Immigrants | India | 18.5 /100 | #202 | Poor 3.21 |
| Immigrants | Nepal | 18.1 /100 | #203 | Poor 3.21 |
| Immigrants | Poland | 16.6 /100 | #204 | Poor 3.20 |
| Paraguayans | 16.3 /100 | #205 | Poor 3.20 |
| Immigrants | Cabo Verde | 16.0 /100 | #206 | Poor 3.20 |
| Filipinos | 13.6 /100 | #207 | Poor 3.20 |
| Chippewa | 13.3 /100 | #208 | Poor 3.20 |
| Sudanese | 13.3 /100 | #209 | Poor 3.20 |