Bolivian vs Immigrants from India Average Family Size
COMPARE
Bolivian
Immigrants from India
Average Family Size
Average Family Size Comparison
Bolivians
Immigrants from India
3.29
AVERAGE FAMILY SIZE
98.3/ 100
METRIC RATING
104th/ 347
METRIC RANK
3.21
AVERAGE FAMILY SIZE
18.5/ 100
METRIC RATING
202nd/ 347
METRIC RANK
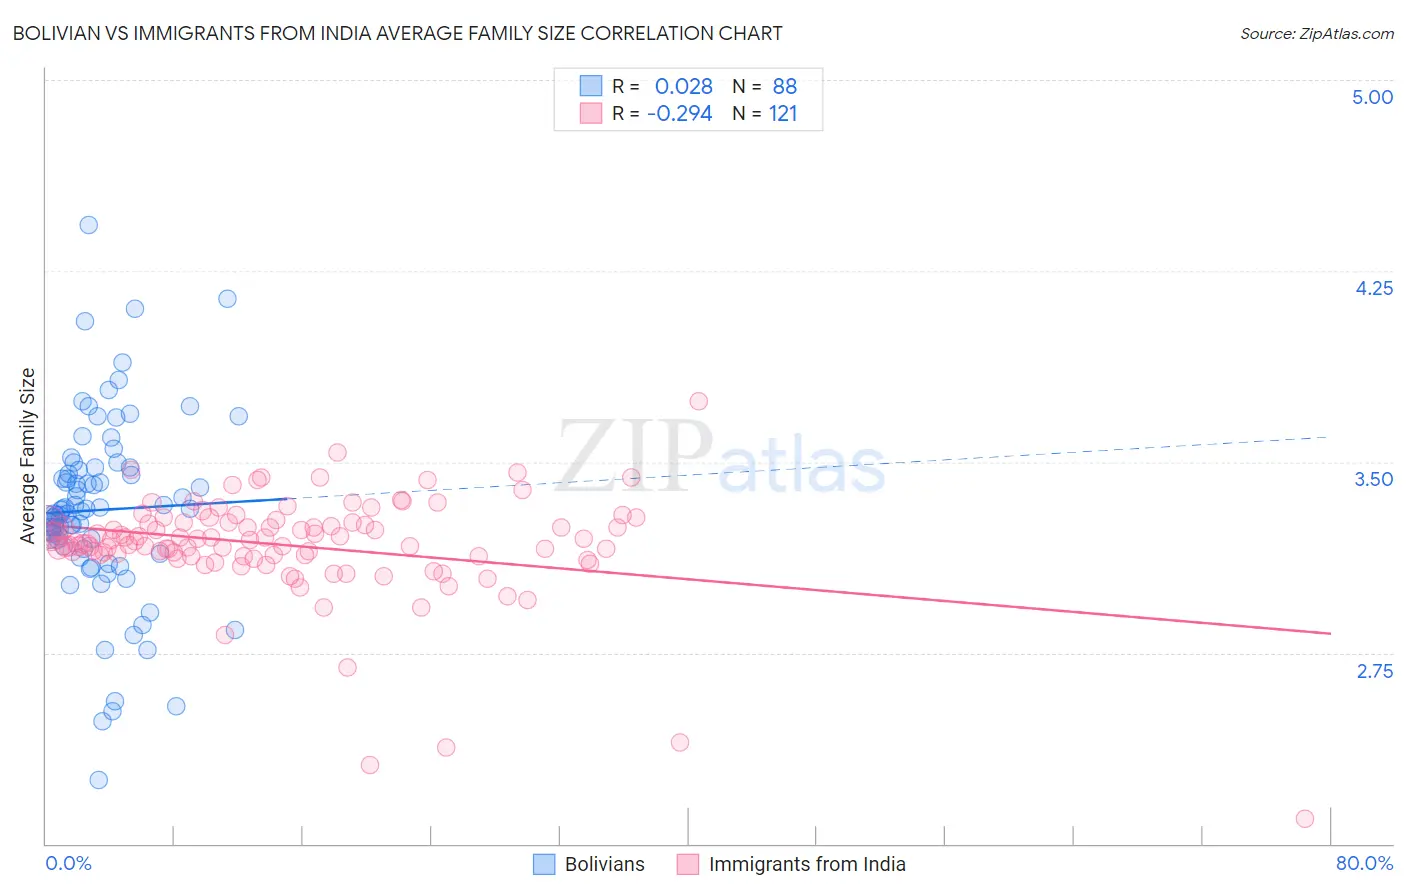
Bolivian vs Immigrants from India Average Family Size Correlation Chart
The statistical analysis conducted on geographies consisting of 184,628,793 people shows no correlation between the proportion of Bolivians and average family size in the United States with a correlation coefficient (R) of 0.028 and weighted average of 3.29. Similarly, the statistical analysis conducted on geographies consisting of 433,752,705 people shows a weak negative correlation between the proportion of Immigrants from India and average family size in the United States with a correlation coefficient (R) of -0.294 and weighted average of 3.21, a difference of 2.5%.
Average Family Size Correlation Summary
| Measurement | Bolivian | Immigrants from India |
| Minimum | 2.25 | 2.10 |
| Maximum | 4.43 | 3.74 |
| Range | 2.18 | 1.64 |
| Mean | 3.31 | 3.17 |
| Median | 3.31 | 3.19 |
| Interquartile 25% (IQ1) | 3.16 | 3.13 |
| Interquartile 75% (IQ3) | 3.47 | 3.26 |
| Interquartile Range (IQR) | 0.31 | 0.13 |
| Standard Deviation (Sample) | 0.36 | 0.21 |
| Standard Deviation (Population) | 0.36 | 0.21 |
Similar Demographics by Average Family Size
Demographics Similar to Bolivians by Average Family Size
In terms of average family size, the demographic groups most similar to Bolivians are Immigrants from Western Africa (3.29, a difference of 0.040%), Immigrants from Ghana (3.29, a difference of 0.050%), Immigrants from Burma/Myanmar (3.29, a difference of 0.070%), West Indian (3.29, a difference of 0.070%), and Paiute (3.29, a difference of 0.070%).
| Demographics | Rating | Rank | Average Family Size |
| Immigrants | Oceania | 98.7 /100 | #97 | Exceptional 3.29 |
| Barbadians | 98.6 /100 | #98 | Exceptional 3.29 |
| Nigerians | 98.6 /100 | #99 | Exceptional 3.29 |
| Guamanians/Chamorros | 98.6 /100 | #100 | Exceptional 3.29 |
| Immigrants | Burma/Myanmar | 98.6 /100 | #101 | Exceptional 3.29 |
| West Indians | 98.5 /100 | #102 | Exceptional 3.29 |
| Immigrants | Western Africa | 98.4 /100 | #103 | Exceptional 3.29 |
| Bolivians | 98.3 /100 | #104 | Exceptional 3.29 |
| Immigrants | Ghana | 98.1 /100 | #105 | Exceptional 3.29 |
| Paiute | 98.0 /100 | #106 | Exceptional 3.29 |
| Ghanaians | 98.0 /100 | #107 | Exceptional 3.29 |
| Asians | 97.0 /100 | #108 | Exceptional 3.28 |
| Puerto Ricans | 96.7 /100 | #109 | Exceptional 3.28 |
| Bahamians | 96.6 /100 | #110 | Exceptional 3.28 |
| Indonesians | 96.2 /100 | #111 | Exceptional 3.28 |
Demographics Similar to Immigrants from India by Average Family Size
In terms of average family size, the demographic groups most similar to Immigrants from India are Immigrants from Morocco (3.21, a difference of 0.0%), Immigrants from Nepal (3.21, a difference of 0.010%), Immigrants from Kenya (3.21, a difference of 0.020%), Immigrants from Poland (3.20, a difference of 0.060%), and Hmong (3.21, a difference of 0.070%).
| Demographics | Rating | Rank | Average Family Size |
| Choctaw | 28.3 /100 | #195 | Fair 3.21 |
| Senegalese | 28.2 /100 | #196 | Fair 3.21 |
| Kenyans | 28.0 /100 | #197 | Fair 3.21 |
| Immigrants | Azores | 21.7 /100 | #198 | Fair 3.21 |
| Hmong | 20.7 /100 | #199 | Fair 3.21 |
| Immigrants | Kenya | 19.2 /100 | #200 | Poor 3.21 |
| Immigrants | Morocco | 18.5 /100 | #201 | Poor 3.21 |
| Immigrants | India | 18.5 /100 | #202 | Poor 3.21 |
| Immigrants | Nepal | 18.1 /100 | #203 | Poor 3.21 |
| Immigrants | Poland | 16.6 /100 | #204 | Poor 3.20 |
| Paraguayans | 16.3 /100 | #205 | Poor 3.20 |
| Immigrants | Cabo Verde | 16.0 /100 | #206 | Poor 3.20 |
| Filipinos | 13.6 /100 | #207 | Poor 3.20 |
| Chippewa | 13.3 /100 | #208 | Poor 3.20 |
| Sudanese | 13.3 /100 | #209 | Poor 3.20 |