Slavic vs Scandinavian Single Mother Households
COMPARE
Slavic
Scandinavian
Single Mother Households
Single Mother Households Comparison
Slavs
Scandinavians
5.9%
SINGLE MOTHER HOUSEHOLDS
92.9/ 100
METRIC RATING
125th/ 347
METRIC RANK
5.8%
SINGLE MOTHER HOUSEHOLDS
96.2/ 100
METRIC RATING
100th/ 347
METRIC RANK
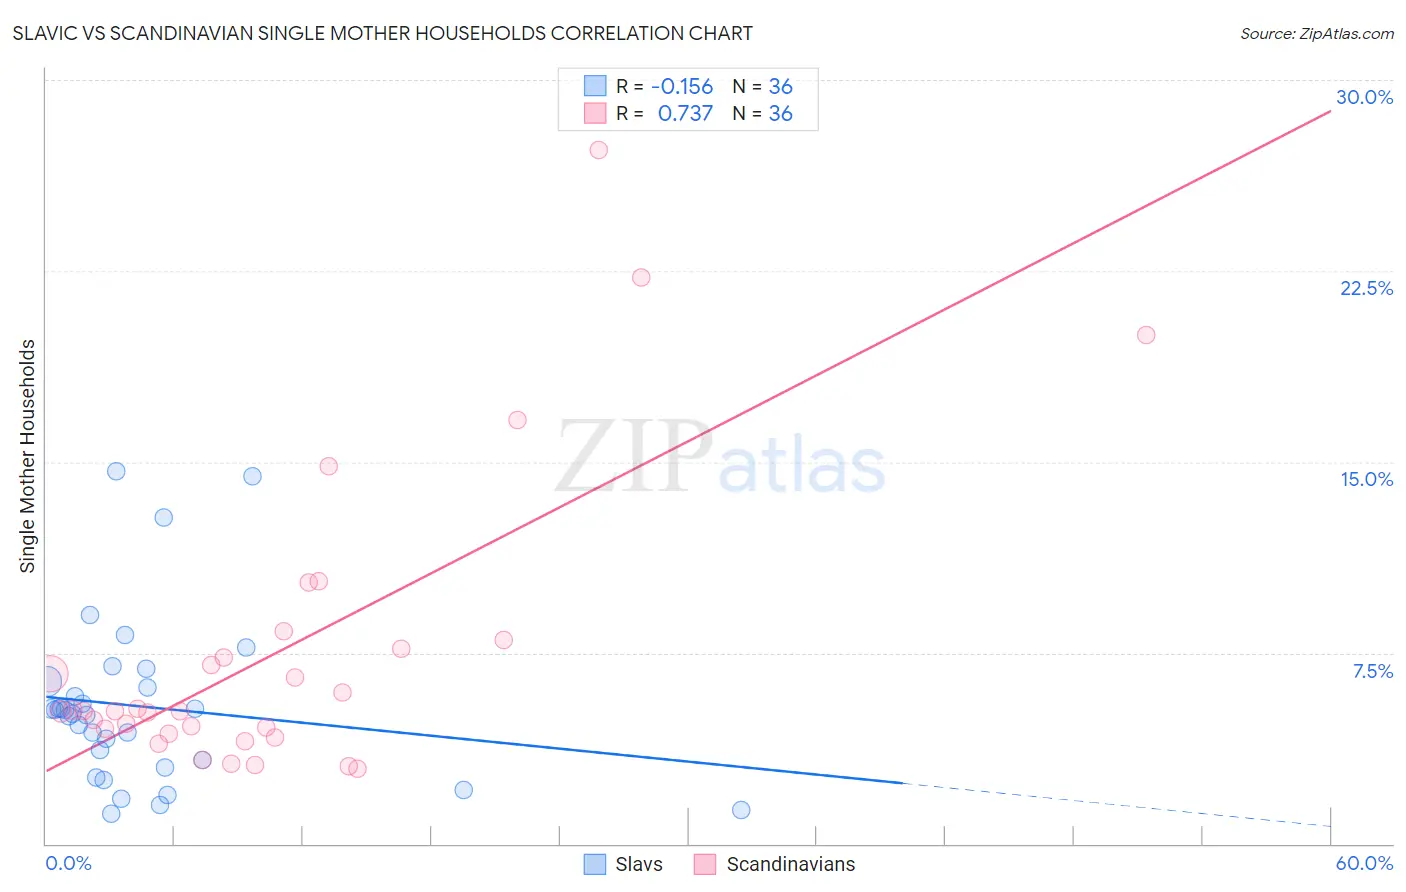
Slavic vs Scandinavian Single Mother Households Correlation Chart
The statistical analysis conducted on geographies consisting of 270,240,357 people shows a poor negative correlation between the proportion of Slavs and percentage of single mother households in the United States with a correlation coefficient (R) of -0.156 and weighted average of 5.9%. Similarly, the statistical analysis conducted on geographies consisting of 470,147,403 people shows a strong positive correlation between the proportion of Scandinavians and percentage of single mother households in the United States with a correlation coefficient (R) of 0.737 and weighted average of 5.8%, a difference of 2.0%.
Single Mother Households Correlation Summary
| Measurement | Slavic | Scandinavian |
| Minimum | 1.2% | 2.9% |
| Maximum | 14.6% | 27.3% |
| Range | 13.5% | 24.3% |
| Mean | 5.4% | 7.5% |
| Median | 5.2% | 5.2% |
| Interquartile 25% (IQ1) | 3.1% | 4.4% |
| Interquartile 75% (IQ3) | 6.3% | 7.8% |
| Interquartile Range (IQR) | 3.1% | 3.4% |
| Standard Deviation (Sample) | 3.3% | 5.7% |
| Standard Deviation (Population) | 3.2% | 5.6% |
Similar Demographics by Single Mother Households
Demographics Similar to Slavs by Single Mother Households
In terms of single mother households, the demographic groups most similar to Slavs are Welsh (5.9%, a difference of 0.020%), Immigrants from Argentina (5.9%, a difference of 0.16%), Lebanese (5.9%, a difference of 0.21%), Immigrants from Uzbekistan (5.9%, a difference of 0.23%), and Belgian (5.8%, a difference of 0.29%).
| Demographics | Rating | Rank | Single Mother Households |
| Laotians | 94.3 /100 | #118 | Exceptional 5.8% |
| South Africans | 94.1 /100 | #119 | Exceptional 5.8% |
| Tongans | 93.7 /100 | #120 | Exceptional 5.8% |
| Argentineans | 93.7 /100 | #121 | Exceptional 5.8% |
| Belgians | 93.5 /100 | #122 | Exceptional 5.8% |
| Immigrants | Uzbekistan | 93.4 /100 | #123 | Exceptional 5.9% |
| Immigrants | Argentina | 93.2 /100 | #124 | Exceptional 5.9% |
| Slavs | 92.9 /100 | #125 | Exceptional 5.9% |
| Welsh | 92.8 /100 | #126 | Exceptional 5.9% |
| Lebanese | 92.4 /100 | #127 | Exceptional 5.9% |
| Czechoslovakians | 92.2 /100 | #128 | Exceptional 5.9% |
| Immigrants | Bolivia | 92.2 /100 | #129 | Exceptional 5.9% |
| Palestinians | 92.1 /100 | #130 | Exceptional 5.9% |
| Immigrants | Spain | 91.2 /100 | #131 | Exceptional 5.9% |
| Albanians | 91.1 /100 | #132 | Exceptional 5.9% |
Demographics Similar to Scandinavians by Single Mother Households
In terms of single mother households, the demographic groups most similar to Scandinavians are Immigrants from Poland (5.8%, a difference of 0.010%), German (5.8%, a difference of 0.030%), English (5.8%, a difference of 0.030%), Scottish (5.8%, a difference of 0.050%), and Northern European (5.8%, a difference of 0.060%).
| Demographics | Rating | Rank | Single Mother Households |
| Serbians | 96.7 /100 | #93 | Exceptional 5.7% |
| Basques | 96.7 /100 | #94 | Exceptional 5.7% |
| Slovaks | 96.6 /100 | #95 | Exceptional 5.7% |
| Austrians | 96.4 /100 | #96 | Exceptional 5.7% |
| Tlingit-Haida | 96.4 /100 | #97 | Exceptional 5.7% |
| Immigrants | South Africa | 96.3 /100 | #98 | Exceptional 5.7% |
| Immigrants | Poland | 96.3 /100 | #99 | Exceptional 5.8% |
| Scandinavians | 96.2 /100 | #100 | Exceptional 5.8% |
| Germans | 96.2 /100 | #101 | Exceptional 5.8% |
| English | 96.2 /100 | #102 | Exceptional 5.8% |
| Scottish | 96.2 /100 | #103 | Exceptional 5.8% |
| Northern Europeans | 96.2 /100 | #104 | Exceptional 5.8% |
| Taiwanese | 96.1 /100 | #105 | Exceptional 5.8% |
| Immigrants | Ukraine | 95.9 /100 | #106 | Exceptional 5.8% |
| Paraguayans | 95.8 /100 | #107 | Exceptional 5.8% |