Slavic vs Immigrants from Zaire Single Mother Households
COMPARE
Slavic
Immigrants from Zaire
Single Mother Households
Single Mother Households Comparison
Slavs
Immigrants from Zaire
5.9%
SINGLE MOTHER HOUSEHOLDS
92.9/ 100
METRIC RATING
125th/ 347
METRIC RANK
7.4%
SINGLE MOTHER HOUSEHOLDS
0.2/ 100
METRIC RATING
260th/ 347
METRIC RANK
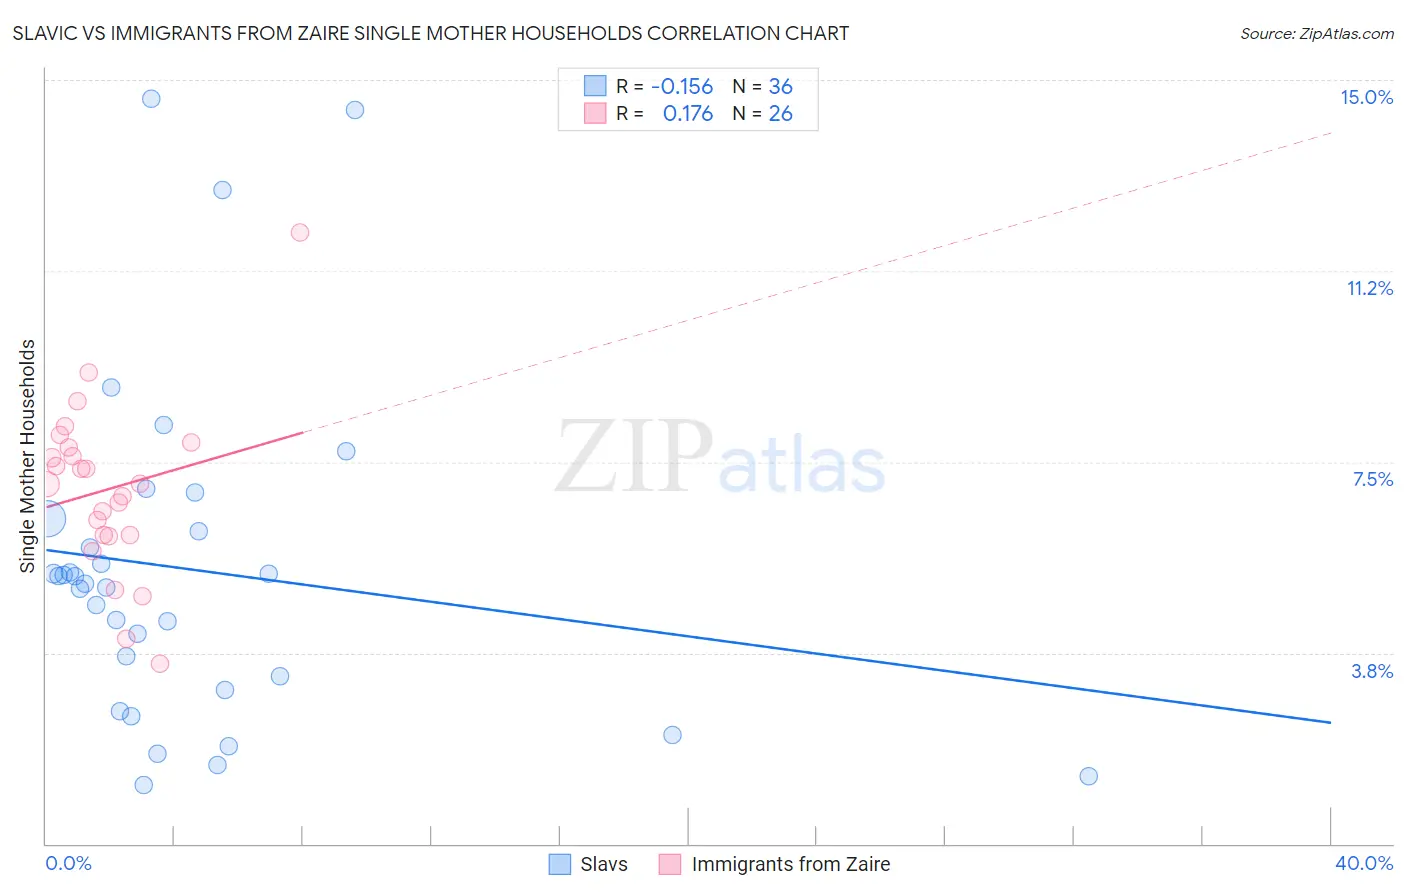
Slavic vs Immigrants from Zaire Single Mother Households Correlation Chart
The statistical analysis conducted on geographies consisting of 270,240,357 people shows a poor negative correlation between the proportion of Slavs and percentage of single mother households in the United States with a correlation coefficient (R) of -0.156 and weighted average of 5.9%. Similarly, the statistical analysis conducted on geographies consisting of 107,226,907 people shows a poor positive correlation between the proportion of Immigrants from Zaire and percentage of single mother households in the United States with a correlation coefficient (R) of 0.176 and weighted average of 7.4%, a difference of 26.2%.
Single Mother Households Correlation Summary
| Measurement | Slavic | Immigrants from Zaire |
| Minimum | 1.2% | 3.5% |
| Maximum | 14.6% | 12.0% |
| Range | 13.5% | 8.5% |
| Mean | 5.4% | 7.0% |
| Median | 5.2% | 7.1% |
| Interquartile 25% (IQ1) | 3.1% | 6.1% |
| Interquartile 75% (IQ3) | 6.3% | 7.8% |
| Interquartile Range (IQR) | 3.1% | 1.7% |
| Standard Deviation (Sample) | 3.3% | 1.7% |
| Standard Deviation (Population) | 3.2% | 1.7% |
Similar Demographics by Single Mother Households
Demographics Similar to Slavs by Single Mother Households
In terms of single mother households, the demographic groups most similar to Slavs are Welsh (5.9%, a difference of 0.020%), Immigrants from Argentina (5.9%, a difference of 0.16%), Lebanese (5.9%, a difference of 0.21%), Immigrants from Uzbekistan (5.9%, a difference of 0.23%), and Belgian (5.8%, a difference of 0.29%).
| Demographics | Rating | Rank | Single Mother Households |
| Laotians | 94.3 /100 | #118 | Exceptional 5.8% |
| South Africans | 94.1 /100 | #119 | Exceptional 5.8% |
| Tongans | 93.7 /100 | #120 | Exceptional 5.8% |
| Argentineans | 93.7 /100 | #121 | Exceptional 5.8% |
| Belgians | 93.5 /100 | #122 | Exceptional 5.8% |
| Immigrants | Uzbekistan | 93.4 /100 | #123 | Exceptional 5.9% |
| Immigrants | Argentina | 93.2 /100 | #124 | Exceptional 5.9% |
| Slavs | 92.9 /100 | #125 | Exceptional 5.9% |
| Welsh | 92.8 /100 | #126 | Exceptional 5.9% |
| Lebanese | 92.4 /100 | #127 | Exceptional 5.9% |
| Czechoslovakians | 92.2 /100 | #128 | Exceptional 5.9% |
| Immigrants | Bolivia | 92.2 /100 | #129 | Exceptional 5.9% |
| Palestinians | 92.1 /100 | #130 | Exceptional 5.9% |
| Immigrants | Spain | 91.2 /100 | #131 | Exceptional 5.9% |
| Albanians | 91.1 /100 | #132 | Exceptional 5.9% |
Demographics Similar to Immigrants from Zaire by Single Mother Households
In terms of single mother households, the demographic groups most similar to Immigrants from Zaire are Japanese (7.4%, a difference of 0.020%), Immigrants from Yemen (7.4%, a difference of 0.040%), Pueblo (7.4%, a difference of 0.060%), Alaska Native (7.4%, a difference of 0.080%), and Seminole (7.4%, a difference of 0.13%).
| Demographics | Rating | Rank | Single Mother Households |
| Cajuns | 0.3 /100 | #253 | Tragic 7.3% |
| Immigrants | Ecuador | 0.3 /100 | #254 | Tragic 7.3% |
| Mexican American Indians | 0.2 /100 | #255 | Tragic 7.4% |
| Seminole | 0.2 /100 | #256 | Tragic 7.4% |
| Alaska Natives | 0.2 /100 | #257 | Tragic 7.4% |
| Pueblo | 0.2 /100 | #258 | Tragic 7.4% |
| Immigrants | Yemen | 0.2 /100 | #259 | Tragic 7.4% |
| Immigrants | Zaire | 0.2 /100 | #260 | Tragic 7.4% |
| Japanese | 0.2 /100 | #261 | Tragic 7.4% |
| Immigrants | Somalia | 0.2 /100 | #262 | Tragic 7.4% |
| Immigrants | Nicaragua | 0.2 /100 | #263 | Tragic 7.4% |
| Yaqui | 0.1 /100 | #264 | Tragic 7.4% |
| Crow | 0.1 /100 | #265 | Tragic 7.4% |
| Nepalese | 0.1 /100 | #266 | Tragic 7.5% |
| Blackfeet | 0.1 /100 | #267 | Tragic 7.5% |