Slavic vs Yakama Single Mother Households
COMPARE
Slavic
Yakama
Single Mother Households
Single Mother Households Comparison
Slavs
Yakama
5.9%
SINGLE MOTHER HOUSEHOLDS
92.9/ 100
METRIC RATING
125th/ 347
METRIC RANK
8.4%
SINGLE MOTHER HOUSEHOLDS
0.0/ 100
METRIC RATING
328th/ 347
METRIC RANK
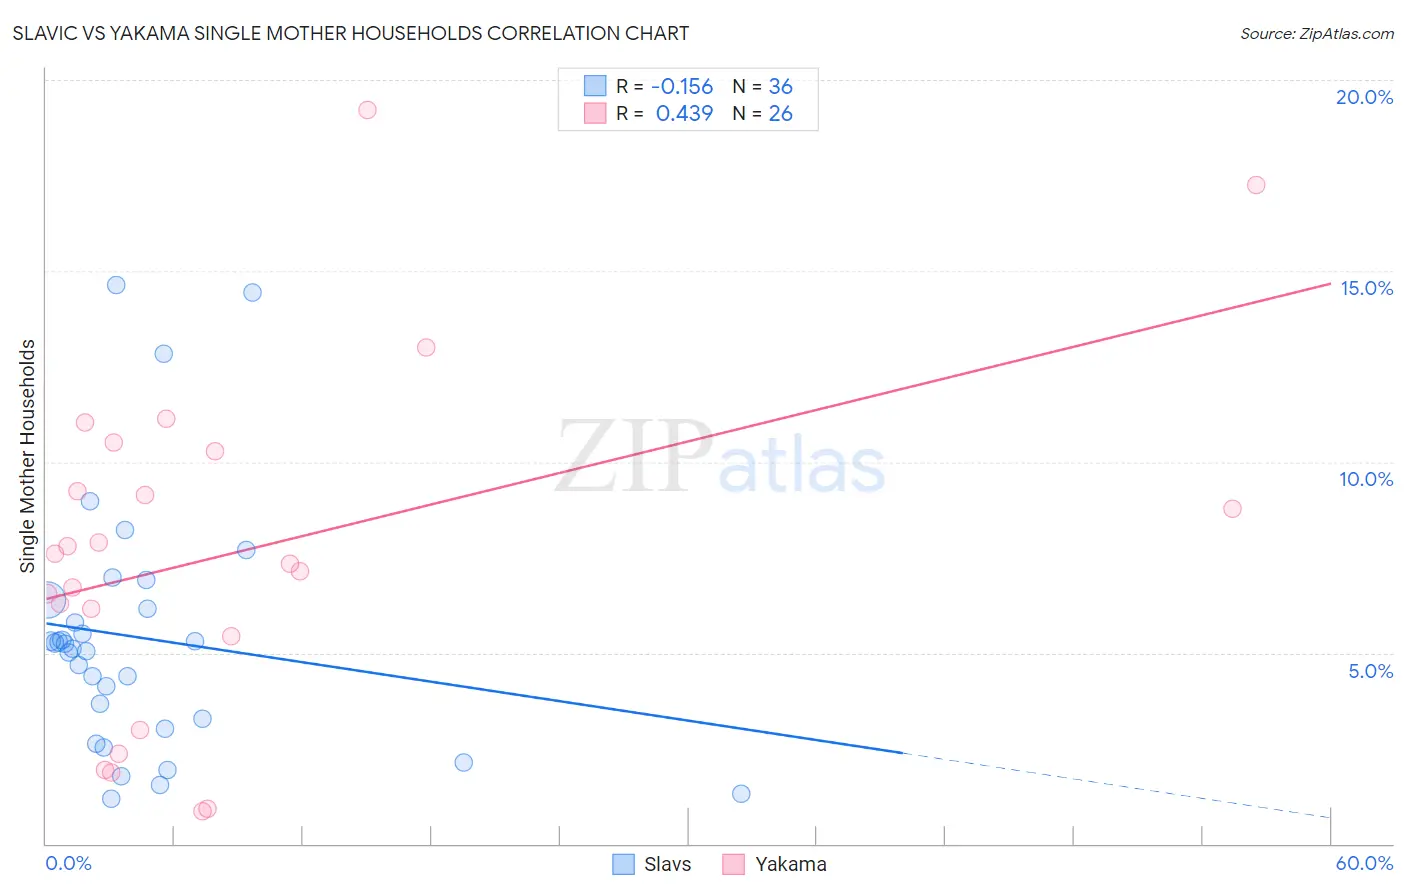
Slavic vs Yakama Single Mother Households Correlation Chart
The statistical analysis conducted on geographies consisting of 270,240,357 people shows a poor negative correlation between the proportion of Slavs and percentage of single mother households in the United States with a correlation coefficient (R) of -0.156 and weighted average of 5.9%. Similarly, the statistical analysis conducted on geographies consisting of 19,909,884 people shows a moderate positive correlation between the proportion of Yakama and percentage of single mother households in the United States with a correlation coefficient (R) of 0.439 and weighted average of 8.4%, a difference of 43.4%.
Single Mother Households Correlation Summary
| Measurement | Slavic | Yakama |
| Minimum | 1.2% | 0.86% |
| Maximum | 14.6% | 19.2% |
| Range | 13.5% | 18.4% |
| Mean | 5.4% | 7.7% |
| Median | 5.2% | 7.5% |
| Interquartile 25% (IQ1) | 3.1% | 5.4% |
| Interquartile 75% (IQ3) | 6.3% | 10.3% |
| Interquartile Range (IQR) | 3.1% | 4.8% |
| Standard Deviation (Sample) | 3.3% | 4.6% |
| Standard Deviation (Population) | 3.2% | 4.5% |
Similar Demographics by Single Mother Households
Demographics Similar to Slavs by Single Mother Households
In terms of single mother households, the demographic groups most similar to Slavs are Welsh (5.9%, a difference of 0.020%), Immigrants from Argentina (5.9%, a difference of 0.16%), Lebanese (5.9%, a difference of 0.21%), Immigrants from Uzbekistan (5.9%, a difference of 0.23%), and Belgian (5.8%, a difference of 0.29%).
| Demographics | Rating | Rank | Single Mother Households |
| Laotians | 94.3 /100 | #118 | Exceptional 5.8% |
| South Africans | 94.1 /100 | #119 | Exceptional 5.8% |
| Tongans | 93.7 /100 | #120 | Exceptional 5.8% |
| Argentineans | 93.7 /100 | #121 | Exceptional 5.8% |
| Belgians | 93.5 /100 | #122 | Exceptional 5.8% |
| Immigrants | Uzbekistan | 93.4 /100 | #123 | Exceptional 5.9% |
| Immigrants | Argentina | 93.2 /100 | #124 | Exceptional 5.9% |
| Slavs | 92.9 /100 | #125 | Exceptional 5.9% |
| Welsh | 92.8 /100 | #126 | Exceptional 5.9% |
| Lebanese | 92.4 /100 | #127 | Exceptional 5.9% |
| Czechoslovakians | 92.2 /100 | #128 | Exceptional 5.9% |
| Immigrants | Bolivia | 92.2 /100 | #129 | Exceptional 5.9% |
| Palestinians | 92.1 /100 | #130 | Exceptional 5.9% |
| Immigrants | Spain | 91.2 /100 | #131 | Exceptional 5.9% |
| Albanians | 91.1 /100 | #132 | Exceptional 5.9% |
Demographics Similar to Yakama by Single Mother Households
In terms of single mother households, the demographic groups most similar to Yakama are Immigrants from Haiti (8.4%, a difference of 0.18%), British West Indian (8.4%, a difference of 0.32%), Immigrants from Caribbean (8.4%, a difference of 0.45%), Immigrants from Jamaica (8.4%, a difference of 0.63%), and Hopi (8.5%, a difference of 0.75%).
| Demographics | Rating | Rank | Single Mother Households |
| Immigrants | Senegal | 0.0 /100 | #321 | Tragic 8.3% |
| Pima | 0.0 /100 | #322 | Tragic 8.3% |
| Haitians | 0.0 /100 | #323 | Tragic 8.3% |
| Immigrants | Jamaica | 0.0 /100 | #324 | Tragic 8.4% |
| Immigrants | Caribbean | 0.0 /100 | #325 | Tragic 8.4% |
| British West Indians | 0.0 /100 | #326 | Tragic 8.4% |
| Immigrants | Haiti | 0.0 /100 | #327 | Tragic 8.4% |
| Yakama | 0.0 /100 | #328 | Tragic 8.4% |
| Hopi | 0.0 /100 | #329 | Tragic 8.5% |
| Inupiat | 0.0 /100 | #330 | Tragic 8.5% |
| Sioux | 0.0 /100 | #331 | Tragic 8.5% |
| U.S. Virgin Islanders | 0.0 /100 | #332 | Tragic 8.6% |
| Liberians | 0.0 /100 | #333 | Tragic 8.6% |
| Immigrants | Liberia | 0.0 /100 | #334 | Tragic 8.7% |
| Immigrants | Dominica | 0.0 /100 | #335 | Tragic 8.7% |