Slavic vs Comanche Child Poverty Among Boys Under 16
COMPARE
Slavic
Comanche
Child Poverty Among Boys Under 16
Child Poverty Among Boys Under 16 Comparison
Slavs
Comanche
15.7%
CHILD POVERTY AMONG BOYS UNDER 16
84.5/ 100
METRIC RATING
141st/ 347
METRIC RANK
20.1%
CHILD POVERTY AMONG BOYS UNDER 16
0.0/ 100
METRIC RATING
282nd/ 347
METRIC RANK
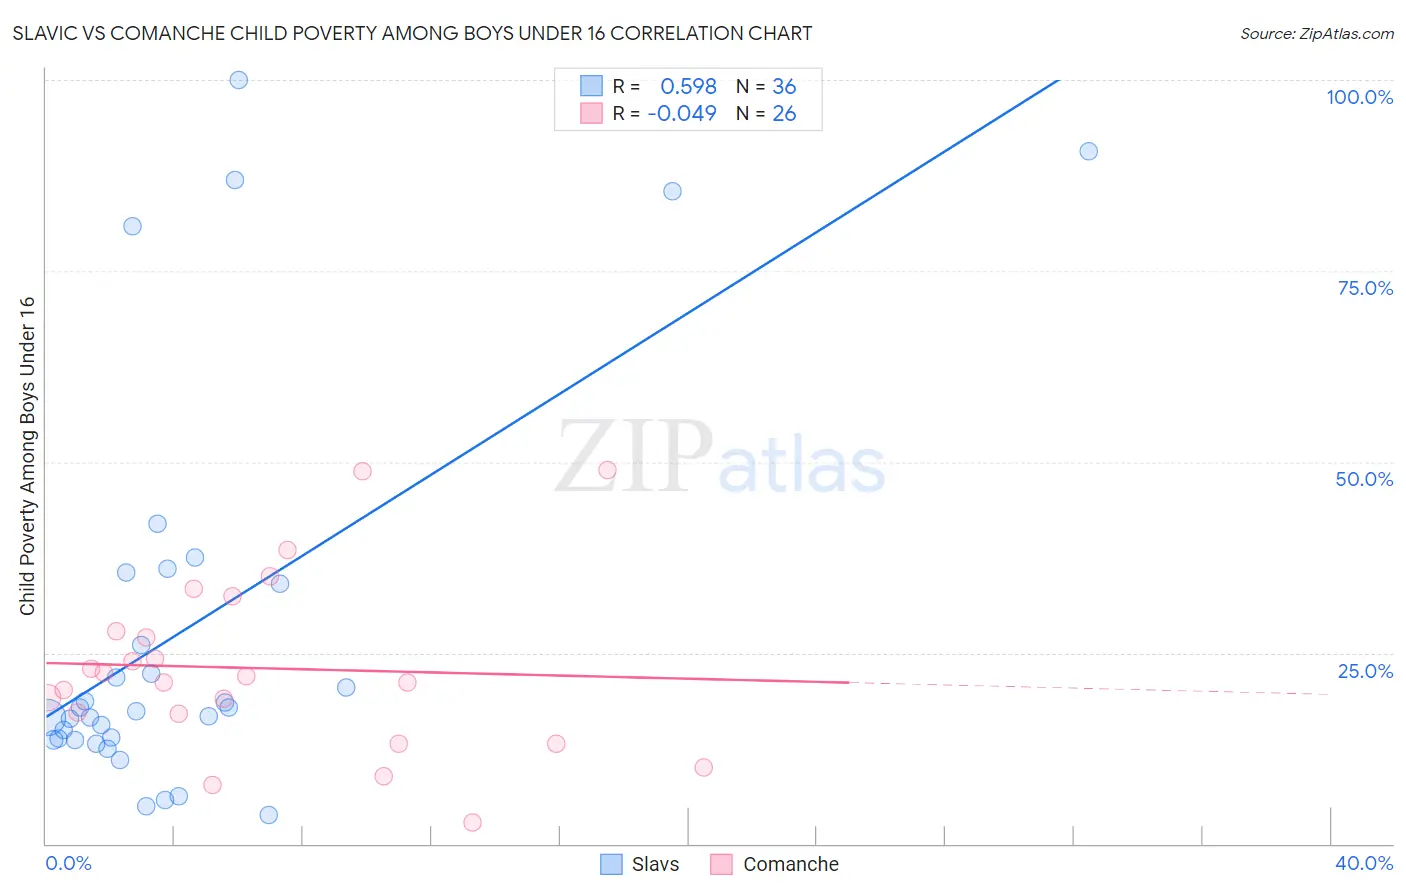
Slavic vs Comanche Child Poverty Among Boys Under 16 Correlation Chart
The statistical analysis conducted on geographies consisting of 267,135,451 people shows a substantial positive correlation between the proportion of Slavs and poverty level among boys under the age of 16 in the United States with a correlation coefficient (R) of 0.598 and weighted average of 15.7%. Similarly, the statistical analysis conducted on geographies consisting of 109,333,383 people shows no correlation between the proportion of Comanche and poverty level among boys under the age of 16 in the United States with a correlation coefficient (R) of -0.049 and weighted average of 20.1%, a difference of 28.2%.
Child Poverty Among Boys Under 16 Correlation Summary
| Measurement | Slavic | Comanche |
| Minimum | 3.7% | 2.8% |
| Maximum | 100.0% | 48.9% |
| Range | 96.3% | 46.1% |
| Mean | 28.3% | 23.0% |
| Median | 17.6% | 21.5% |
| Interquartile 25% (IQ1) | 13.7% | 17.0% |
| Interquartile 75% (IQ3) | 34.8% | 27.8% |
| Interquartile Range (IQR) | 21.1% | 10.9% |
| Standard Deviation (Sample) | 26.3% | 11.5% |
| Standard Deviation (Population) | 26.0% | 11.2% |
Similar Demographics by Child Poverty Among Boys Under 16
Demographics Similar to Slavs by Child Poverty Among Boys Under 16
In terms of child poverty among boys under 16, the demographic groups most similar to Slavs are Immigrants from Hungary (15.7%, a difference of 0.090%), Immigrants from Fiji (15.7%, a difference of 0.19%), Immigrants from Peru (15.7%, a difference of 0.22%), Immigrants from Kuwait (15.6%, a difference of 0.26%), and Samoan (15.7%, a difference of 0.27%).
| Demographics | Rating | Rank | Child Poverty Among Boys Under 16 |
| Peruvians | 88.1 /100 | #134 | Excellent 15.5% |
| Portuguese | 87.5 /100 | #135 | Excellent 15.5% |
| Icelanders | 87.5 /100 | #136 | Excellent 15.5% |
| Immigrants | Spain | 87.1 /100 | #137 | Excellent 15.6% |
| Immigrants | Southern Europe | 86.5 /100 | #138 | Excellent 15.6% |
| Albanians | 86.5 /100 | #139 | Excellent 15.6% |
| Immigrants | Kuwait | 85.6 /100 | #140 | Excellent 15.6% |
| Slavs | 84.5 /100 | #141 | Excellent 15.7% |
| Immigrants | Hungary | 84.1 /100 | #142 | Excellent 15.7% |
| Immigrants | Fiji | 83.6 /100 | #143 | Excellent 15.7% |
| Immigrants | Peru | 83.5 /100 | #144 | Excellent 15.7% |
| Samoans | 83.2 /100 | #145 | Excellent 15.7% |
| New Zealanders | 82.4 /100 | #146 | Excellent 15.7% |
| Venezuelans | 82.1 /100 | #147 | Excellent 15.7% |
| Brazilians | 81.0 /100 | #148 | Excellent 15.8% |
Demographics Similar to Comanche by Child Poverty Among Boys Under 16
In terms of child poverty among boys under 16, the demographic groups most similar to Comanche are Immigrants from Zaire (20.1%, a difference of 0.050%), Central American (20.1%, a difference of 0.11%), Immigrants from Jamaica (20.1%, a difference of 0.13%), Bangladeshi (20.0%, a difference of 0.23%), and Immigrants from West Indies (20.0%, a difference of 0.36%).
| Demographics | Rating | Rank | Child Poverty Among Boys Under 16 |
| Jamaicans | 0.0 /100 | #275 | Tragic 20.0% |
| Sub-Saharan Africans | 0.0 /100 | #276 | Tragic 20.0% |
| Immigrants | Barbados | 0.0 /100 | #277 | Tragic 20.0% |
| Immigrants | West Indies | 0.0 /100 | #278 | Tragic 20.0% |
| Bangladeshis | 0.0 /100 | #279 | Tragic 20.0% |
| Central Americans | 0.0 /100 | #280 | Tragic 20.1% |
| Immigrants | Zaire | 0.0 /100 | #281 | Tragic 20.1% |
| Comanche | 0.0 /100 | #282 | Tragic 20.1% |
| Immigrants | Jamaica | 0.0 /100 | #283 | Tragic 20.1% |
| Barbadians | 0.0 /100 | #284 | Tragic 20.2% |
| Arapaho | 0.0 /100 | #285 | Tragic 20.2% |
| West Indians | 0.0 /100 | #286 | Tragic 20.3% |
| Immigrants | Belize | 0.0 /100 | #287 | Tragic 20.3% |
| Immigrants | St. Vincent and the Grenadines | 0.0 /100 | #288 | Tragic 20.3% |
| Blackfeet | 0.0 /100 | #289 | Tragic 20.4% |