Slavic vs Vietnamese Single Mother Households
COMPARE
Slavic
Vietnamese
Single Mother Households
Single Mother Households Comparison
Slavs
Vietnamese
5.9%
SINGLE MOTHER HOUSEHOLDS
92.9/ 100
METRIC RATING
125th/ 347
METRIC RANK
6.7%
SINGLE MOTHER HOUSEHOLDS
11.3/ 100
METRIC RATING
208th/ 347
METRIC RANK
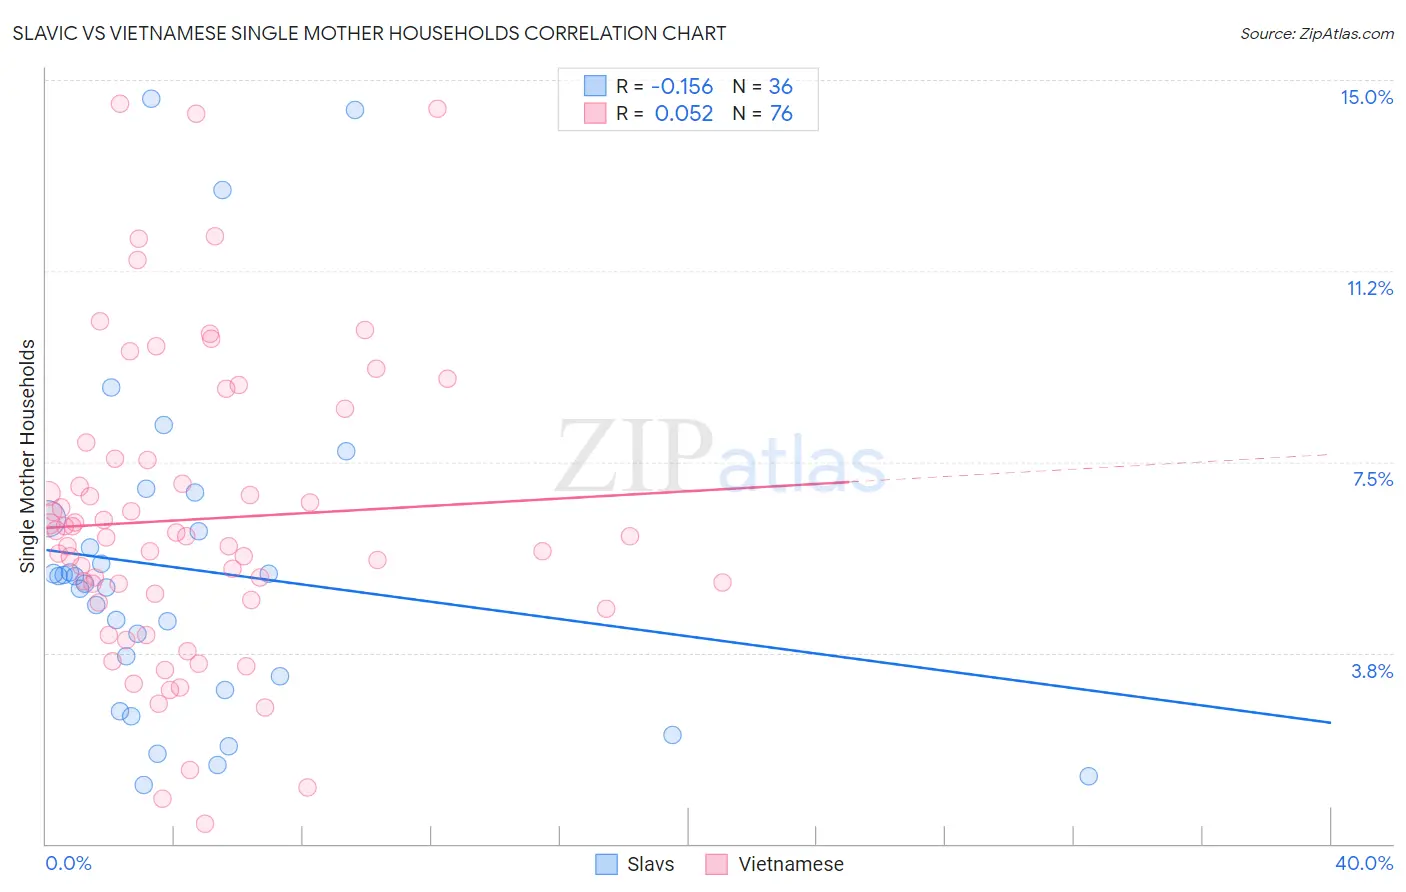
Slavic vs Vietnamese Single Mother Households Correlation Chart
The statistical analysis conducted on geographies consisting of 270,240,357 people shows a poor negative correlation between the proportion of Slavs and percentage of single mother households in the United States with a correlation coefficient (R) of -0.156 and weighted average of 5.9%. Similarly, the statistical analysis conducted on geographies consisting of 170,499,454 people shows a slight positive correlation between the proportion of Vietnamese and percentage of single mother households in the United States with a correlation coefficient (R) of 0.052 and weighted average of 6.7%, a difference of 13.6%.
Single Mother Households Correlation Summary
| Measurement | Slavic | Vietnamese |
| Minimum | 1.2% | 0.40% |
| Maximum | 14.6% | 14.5% |
| Range | 13.5% | 14.1% |
| Mean | 5.4% | 6.4% |
| Median | 5.2% | 6.0% |
| Interquartile 25% (IQ1) | 3.1% | 4.8% |
| Interquartile 75% (IQ3) | 6.3% | 7.6% |
| Interquartile Range (IQR) | 3.1% | 2.8% |
| Standard Deviation (Sample) | 3.3% | 3.0% |
| Standard Deviation (Population) | 3.2% | 2.9% |
Similar Demographics by Single Mother Households
Demographics Similar to Slavs by Single Mother Households
In terms of single mother households, the demographic groups most similar to Slavs are Welsh (5.9%, a difference of 0.020%), Immigrants from Argentina (5.9%, a difference of 0.16%), Lebanese (5.9%, a difference of 0.21%), Immigrants from Uzbekistan (5.9%, a difference of 0.23%), and Belgian (5.8%, a difference of 0.29%).
| Demographics | Rating | Rank | Single Mother Households |
| Laotians | 94.3 /100 | #118 | Exceptional 5.8% |
| South Africans | 94.1 /100 | #119 | Exceptional 5.8% |
| Tongans | 93.7 /100 | #120 | Exceptional 5.8% |
| Argentineans | 93.7 /100 | #121 | Exceptional 5.8% |
| Belgians | 93.5 /100 | #122 | Exceptional 5.8% |
| Immigrants | Uzbekistan | 93.4 /100 | #123 | Exceptional 5.9% |
| Immigrants | Argentina | 93.2 /100 | #124 | Exceptional 5.9% |
| Slavs | 92.9 /100 | #125 | Exceptional 5.9% |
| Welsh | 92.8 /100 | #126 | Exceptional 5.9% |
| Lebanese | 92.4 /100 | #127 | Exceptional 5.9% |
| Czechoslovakians | 92.2 /100 | #128 | Exceptional 5.9% |
| Immigrants | Bolivia | 92.2 /100 | #129 | Exceptional 5.9% |
| Palestinians | 92.1 /100 | #130 | Exceptional 5.9% |
| Immigrants | Spain | 91.2 /100 | #131 | Exceptional 5.9% |
| Albanians | 91.1 /100 | #132 | Exceptional 5.9% |
Demographics Similar to Vietnamese by Single Mother Households
In terms of single mother households, the demographic groups most similar to Vietnamese are German Russian (6.7%, a difference of 0.050%), Immigrants from South America (6.7%, a difference of 0.050%), Cree (6.7%, a difference of 0.14%), Immigrants from Fiji (6.7%, a difference of 0.15%), and Immigrants from Peru (6.7%, a difference of 0.17%).
| Demographics | Rating | Rank | Single Mother Households |
| Venezuelans | 12.9 /100 | #201 | Poor 6.6% |
| Guamanians/Chamorros | 12.4 /100 | #202 | Poor 6.6% |
| Immigrants | Peru | 12.0 /100 | #203 | Poor 6.7% |
| Immigrants | Fiji | 11.9 /100 | #204 | Poor 6.7% |
| Cree | 11.9 /100 | #205 | Poor 6.7% |
| German Russians | 11.5 /100 | #206 | Poor 6.7% |
| Immigrants | South America | 11.5 /100 | #207 | Poor 6.7% |
| Vietnamese | 11.3 /100 | #208 | Poor 6.7% |
| Immigrants | Colombia | 10.5 /100 | #209 | Poor 6.7% |
| Immigrants | Nonimmigrants | 10.4 /100 | #210 | Poor 6.7% |
| Immigrants | Venezuela | 8.5 /100 | #211 | Tragic 6.7% |
| Immigrants | Eritrea | 8.4 /100 | #212 | Tragic 6.7% |
| Immigrants | Costa Rica | 8.2 /100 | #213 | Tragic 6.7% |
| Immigrants | Uruguay | 7.9 /100 | #214 | Tragic 6.7% |
| Shoshone | 5.7 /100 | #215 | Tragic 6.8% |