Sioux vs Immigrants from Scotland Single Mother Households
COMPARE
Sioux
Immigrants from Scotland
Single Mother Households
Single Mother Households Comparison
Sioux
Immigrants from Scotland
8.5%
SINGLE MOTHER HOUSEHOLDS
0.0/ 100
METRIC RATING
331st/ 347
METRIC RANK
5.5%
SINGLE MOTHER HOUSEHOLDS
99.2/ 100
METRIC RATING
50th/ 347
METRIC RANK
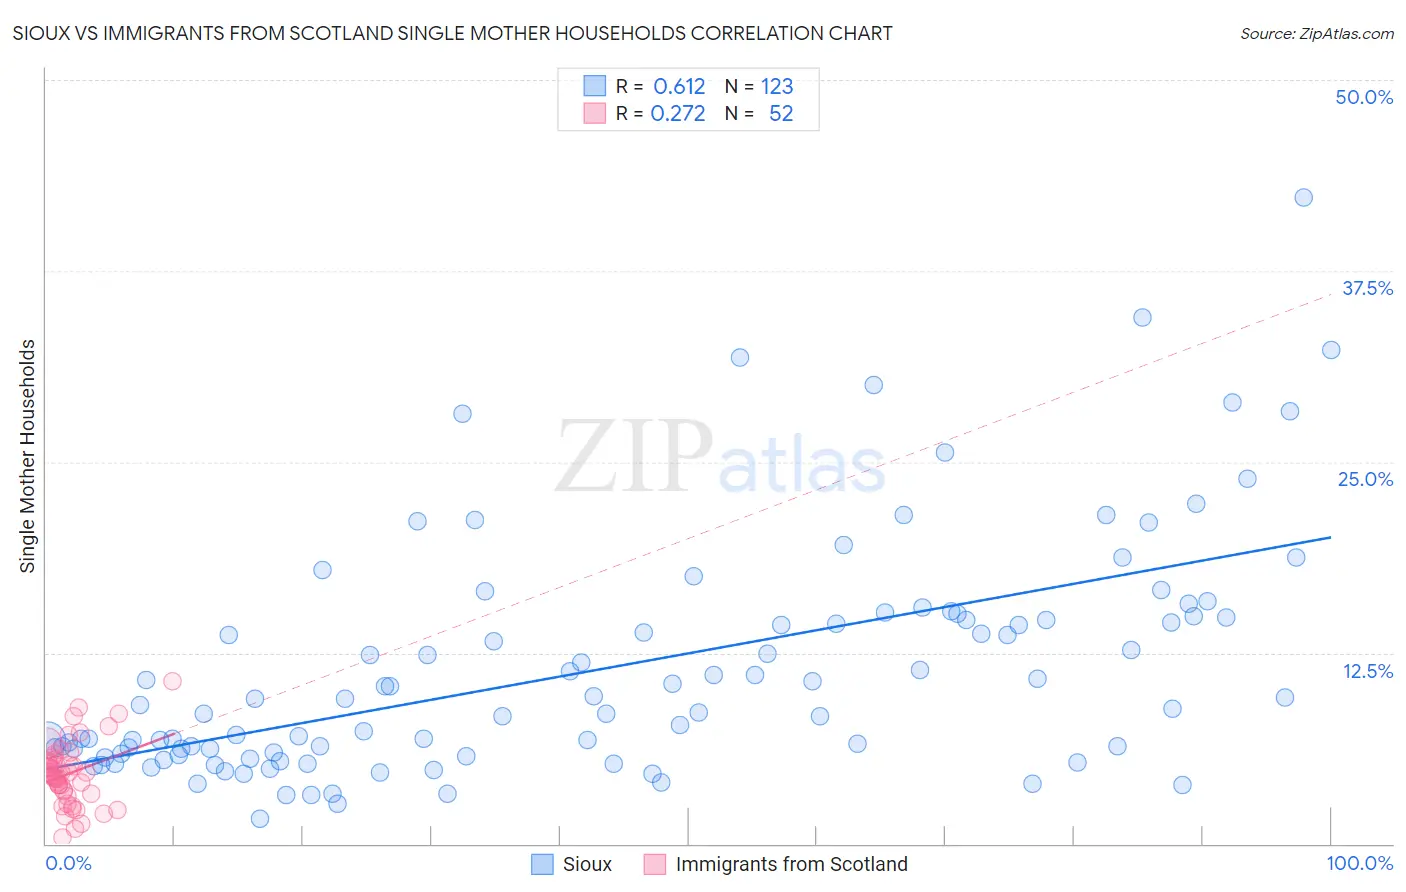
Sioux vs Immigrants from Scotland Single Mother Households Correlation Chart
The statistical analysis conducted on geographies consisting of 233,811,007 people shows a significant positive correlation between the proportion of Sioux and percentage of single mother households in the United States with a correlation coefficient (R) of 0.612 and weighted average of 8.5%. Similarly, the statistical analysis conducted on geographies consisting of 195,996,890 people shows a weak positive correlation between the proportion of Immigrants from Scotland and percentage of single mother households in the United States with a correlation coefficient (R) of 0.272 and weighted average of 5.5%, a difference of 54.6%.
Single Mother Households Correlation Summary
| Measurement | Sioux | Immigrants from Scotland |
| Minimum | 1.6% | 0.38% |
| Maximum | 42.3% | 10.6% |
| Range | 40.7% | 10.2% |
| Mean | 11.4% | 4.6% |
| Median | 9.1% | 4.6% |
| Interquartile 25% (IQ1) | 5.9% | 3.4% |
| Interquartile 75% (IQ3) | 14.8% | 5.4% |
| Interquartile Range (IQR) | 8.9% | 2.0% |
| Standard Deviation (Sample) | 7.6% | 2.1% |
| Standard Deviation (Population) | 7.6% | 2.0% |
Similar Demographics by Single Mother Households
Demographics Similar to Sioux by Single Mother Households
In terms of single mother households, the demographic groups most similar to Sioux are Inupiat (8.5%, a difference of 0.0%), Hopi (8.5%, a difference of 0.11%), Yakama (8.4%, a difference of 0.86%), Immigrants from Haiti (8.4%, a difference of 1.0%), and British West Indian (8.4%, a difference of 1.2%).
| Demographics | Rating | Rank | Single Mother Households |
| Immigrants | Jamaica | 0.0 /100 | #324 | Tragic 8.4% |
| Immigrants | Caribbean | 0.0 /100 | #325 | Tragic 8.4% |
| British West Indians | 0.0 /100 | #326 | Tragic 8.4% |
| Immigrants | Haiti | 0.0 /100 | #327 | Tragic 8.4% |
| Yakama | 0.0 /100 | #328 | Tragic 8.4% |
| Hopi | 0.0 /100 | #329 | Tragic 8.5% |
| Inupiat | 0.0 /100 | #330 | Tragic 8.5% |
| Sioux | 0.0 /100 | #331 | Tragic 8.5% |
| U.S. Virgin Islanders | 0.0 /100 | #332 | Tragic 8.6% |
| Liberians | 0.0 /100 | #333 | Tragic 8.6% |
| Immigrants | Liberia | 0.0 /100 | #334 | Tragic 8.7% |
| Immigrants | Dominica | 0.0 /100 | #335 | Tragic 8.7% |
| Puerto Ricans | 0.0 /100 | #336 | Tragic 8.7% |
| Navajo | 0.0 /100 | #337 | Tragic 8.8% |
| Cape Verdeans | 0.0 /100 | #338 | Tragic 8.9% |
Demographics Similar to Immigrants from Scotland by Single Mother Households
In terms of single mother households, the demographic groups most similar to Immigrants from Scotland are Immigrants from Belarus (5.5%, a difference of 0.020%), Swedish (5.5%, a difference of 0.080%), Immigrants from Russia (5.5%, a difference of 0.18%), Immigrants from Latvia (5.5%, a difference of 0.19%), and Immigrants from Lebanon (5.5%, a difference of 0.20%).
| Demographics | Rating | Rank | Single Mother Households |
| Immigrants | South Central Asia | 99.5 /100 | #43 | Exceptional 5.4% |
| Lithuanians | 99.4 /100 | #44 | Exceptional 5.4% |
| Immigrants | Croatia | 99.4 /100 | #45 | Exceptional 5.4% |
| Croatians | 99.3 /100 | #46 | Exceptional 5.5% |
| Norwegians | 99.3 /100 | #47 | Exceptional 5.5% |
| Turks | 99.2 /100 | #48 | Exceptional 5.5% |
| Immigrants | Latvia | 99.2 /100 | #49 | Exceptional 5.5% |
| Immigrants | Scotland | 99.2 /100 | #50 | Exceptional 5.5% |
| Immigrants | Belarus | 99.2 /100 | #51 | Exceptional 5.5% |
| Swedes | 99.1 /100 | #52 | Exceptional 5.5% |
| Immigrants | Russia | 99.1 /100 | #53 | Exceptional 5.5% |
| Immigrants | Lebanon | 99.1 /100 | #54 | Exceptional 5.5% |
| Immigrants | Denmark | 99.1 /100 | #55 | Exceptional 5.5% |
| Immigrants | Romania | 99.0 /100 | #56 | Exceptional 5.5% |
| Immigrants | Europe | 99.0 /100 | #57 | Exceptional 5.5% |