Sioux vs Immigrants from Eastern Africa Single Mother Households
COMPARE
Sioux
Immigrants from Eastern Africa
Single Mother Households
Single Mother Households Comparison
Sioux
Immigrants from Eastern Africa
8.5%
SINGLE MOTHER HOUSEHOLDS
0.0/ 100
METRIC RATING
331st/ 347
METRIC RANK
6.8%
SINGLE MOTHER HOUSEHOLDS
4.4/ 100
METRIC RATING
218th/ 347
METRIC RANK
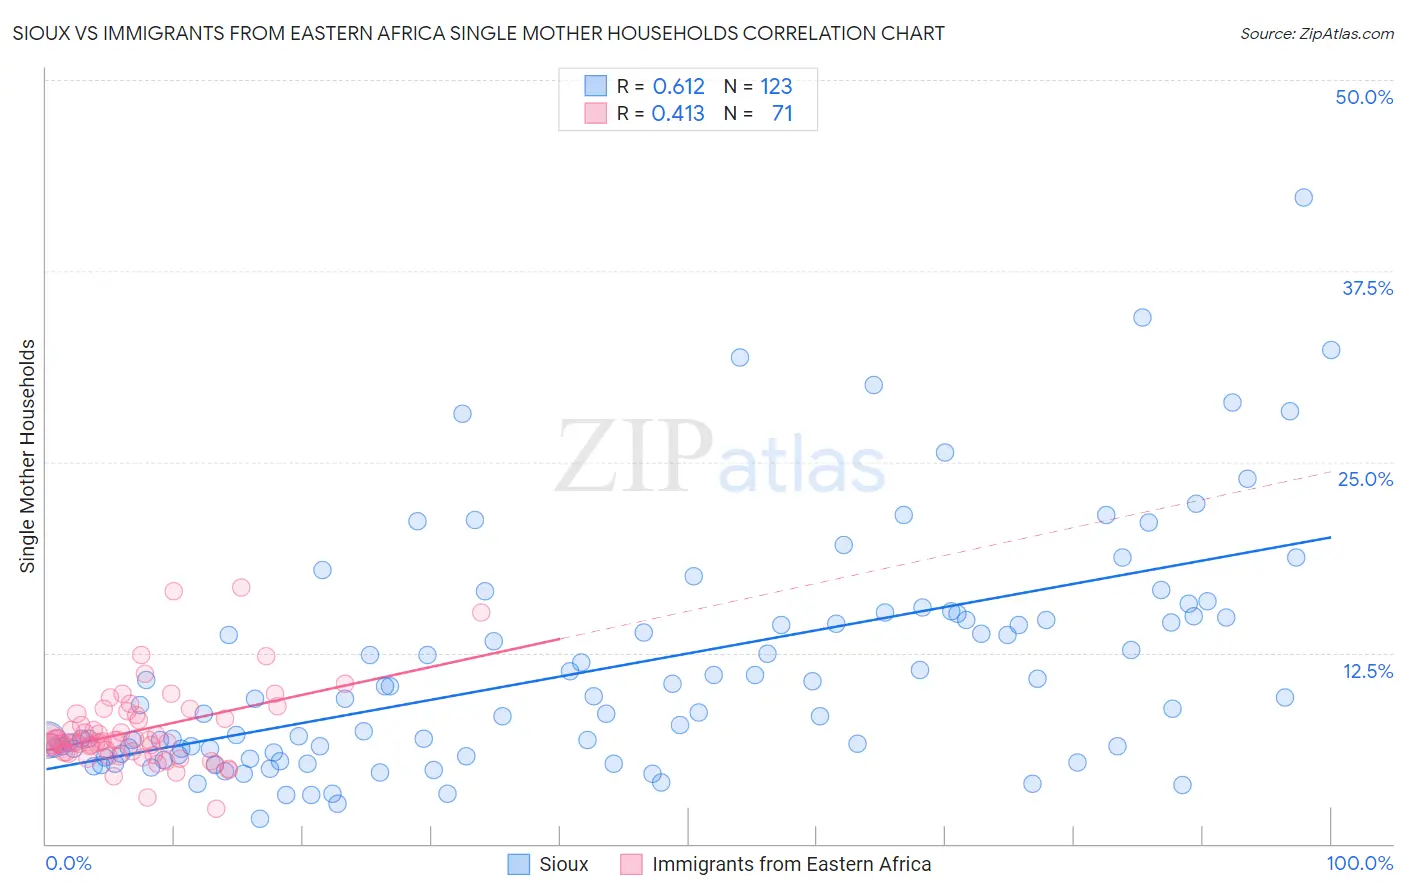
Sioux vs Immigrants from Eastern Africa Single Mother Households Correlation Chart
The statistical analysis conducted on geographies consisting of 233,811,007 people shows a significant positive correlation between the proportion of Sioux and percentage of single mother households in the United States with a correlation coefficient (R) of 0.612 and weighted average of 8.5%. Similarly, the statistical analysis conducted on geographies consisting of 354,507,775 people shows a moderate positive correlation between the proportion of Immigrants from Eastern Africa and percentage of single mother households in the United States with a correlation coefficient (R) of 0.413 and weighted average of 6.8%, a difference of 24.0%.
Single Mother Households Correlation Summary
| Measurement | Sioux | Immigrants from Eastern Africa |
| Minimum | 1.6% | 2.3% |
| Maximum | 42.3% | 16.8% |
| Range | 40.7% | 14.5% |
| Mean | 11.4% | 7.4% |
| Median | 9.1% | 6.8% |
| Interquartile 25% (IQ1) | 5.9% | 6.0% |
| Interquartile 75% (IQ3) | 14.8% | 8.4% |
| Interquartile Range (IQR) | 8.9% | 2.4% |
| Standard Deviation (Sample) | 7.6% | 2.6% |
| Standard Deviation (Population) | 7.6% | 2.6% |
Similar Demographics by Single Mother Households
Demographics Similar to Sioux by Single Mother Households
In terms of single mother households, the demographic groups most similar to Sioux are Inupiat (8.5%, a difference of 0.0%), Hopi (8.5%, a difference of 0.11%), Yakama (8.4%, a difference of 0.86%), Immigrants from Haiti (8.4%, a difference of 1.0%), and British West Indian (8.4%, a difference of 1.2%).
| Demographics | Rating | Rank | Single Mother Households |
| Immigrants | Jamaica | 0.0 /100 | #324 | Tragic 8.4% |
| Immigrants | Caribbean | 0.0 /100 | #325 | Tragic 8.4% |
| British West Indians | 0.0 /100 | #326 | Tragic 8.4% |
| Immigrants | Haiti | 0.0 /100 | #327 | Tragic 8.4% |
| Yakama | 0.0 /100 | #328 | Tragic 8.4% |
| Hopi | 0.0 /100 | #329 | Tragic 8.5% |
| Inupiat | 0.0 /100 | #330 | Tragic 8.5% |
| Sioux | 0.0 /100 | #331 | Tragic 8.5% |
| U.S. Virgin Islanders | 0.0 /100 | #332 | Tragic 8.6% |
| Liberians | 0.0 /100 | #333 | Tragic 8.6% |
| Immigrants | Liberia | 0.0 /100 | #334 | Tragic 8.7% |
| Immigrants | Dominica | 0.0 /100 | #335 | Tragic 8.7% |
| Puerto Ricans | 0.0 /100 | #336 | Tragic 8.7% |
| Navajo | 0.0 /100 | #337 | Tragic 8.8% |
| Cape Verdeans | 0.0 /100 | #338 | Tragic 8.9% |
Demographics Similar to Immigrants from Eastern Africa by Single Mother Households
In terms of single mother households, the demographic groups most similar to Immigrants from Eastern Africa are Immigrants (6.8%, a difference of 0.090%), Aleut (6.8%, a difference of 0.21%), Immigrants from Thailand (6.9%, a difference of 0.27%), Cherokee (6.8%, a difference of 0.36%), and French American Indian (6.9%, a difference of 0.47%).
| Demographics | Rating | Rank | Single Mother Households |
| Immigrants | Venezuela | 8.5 /100 | #211 | Tragic 6.7% |
| Immigrants | Eritrea | 8.4 /100 | #212 | Tragic 6.7% |
| Immigrants | Costa Rica | 8.2 /100 | #213 | Tragic 6.7% |
| Immigrants | Uruguay | 7.9 /100 | #214 | Tragic 6.7% |
| Shoshone | 5.7 /100 | #215 | Tragic 6.8% |
| Cherokee | 5.1 /100 | #216 | Tragic 6.8% |
| Aleuts | 4.8 /100 | #217 | Tragic 6.8% |
| Immigrants | Eastern Africa | 4.4 /100 | #218 | Tragic 6.8% |
| Immigrants | Immigrants | 4.3 /100 | #219 | Tragic 6.8% |
| Immigrants | Thailand | 4.0 /100 | #220 | Tragic 6.9% |
| French American Indians | 3.7 /100 | #221 | Tragic 6.9% |
| Immigrants | Bangladesh | 3.7 /100 | #222 | Tragic 6.9% |
| Immigrants | Micronesia | 3.6 /100 | #223 | Tragic 6.9% |
| Immigrants | Sudan | 3.5 /100 | #224 | Tragic 6.9% |
| Sudanese | 3.1 /100 | #225 | Tragic 6.9% |