Sioux vs Immigrants from Barbados Single Mother Households
COMPARE
Sioux
Immigrants from Barbados
Single Mother Households
Single Mother Households Comparison
Sioux
Immigrants from Barbados
8.5%
SINGLE MOTHER HOUSEHOLDS
0.0/ 100
METRIC RATING
331st/ 347
METRIC RANK
8.0%
SINGLE MOTHER HOUSEHOLDS
0.0/ 100
METRIC RATING
306th/ 347
METRIC RANK
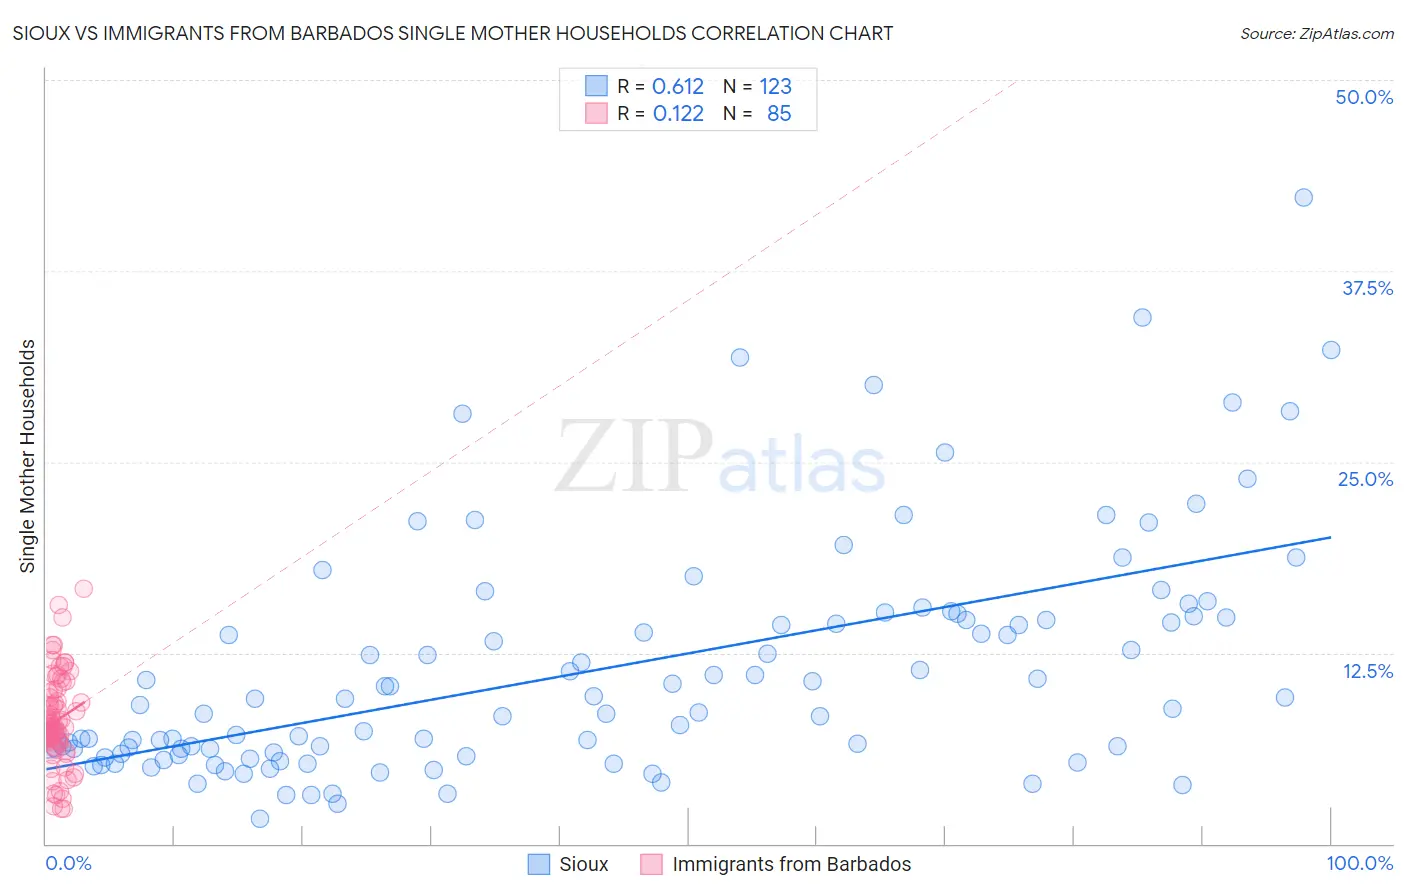
Sioux vs Immigrants from Barbados Single Mother Households Correlation Chart
The statistical analysis conducted on geographies consisting of 233,811,007 people shows a significant positive correlation between the proportion of Sioux and percentage of single mother households in the United States with a correlation coefficient (R) of 0.612 and weighted average of 8.5%. Similarly, the statistical analysis conducted on geographies consisting of 112,754,118 people shows a poor positive correlation between the proportion of Immigrants from Barbados and percentage of single mother households in the United States with a correlation coefficient (R) of 0.122 and weighted average of 8.0%, a difference of 5.6%.
Single Mother Households Correlation Summary
| Measurement | Sioux | Immigrants from Barbados |
| Minimum | 1.6% | 2.3% |
| Maximum | 42.3% | 16.7% |
| Range | 40.7% | 14.4% |
| Mean | 11.4% | 8.1% |
| Median | 9.1% | 7.6% |
| Interquartile 25% (IQ1) | 5.9% | 6.7% |
| Interquartile 75% (IQ3) | 14.8% | 9.7% |
| Interquartile Range (IQR) | 8.9% | 3.0% |
| Standard Deviation (Sample) | 7.6% | 2.9% |
| Standard Deviation (Population) | 7.6% | 2.9% |
Similar Demographics by Single Mother Households
Demographics Similar to Sioux by Single Mother Households
In terms of single mother households, the demographic groups most similar to Sioux are Inupiat (8.5%, a difference of 0.0%), Hopi (8.5%, a difference of 0.11%), Yakama (8.4%, a difference of 0.86%), Immigrants from Haiti (8.4%, a difference of 1.0%), and British West Indian (8.4%, a difference of 1.2%).
| Demographics | Rating | Rank | Single Mother Households |
| Immigrants | Jamaica | 0.0 /100 | #324 | Tragic 8.4% |
| Immigrants | Caribbean | 0.0 /100 | #325 | Tragic 8.4% |
| British West Indians | 0.0 /100 | #326 | Tragic 8.4% |
| Immigrants | Haiti | 0.0 /100 | #327 | Tragic 8.4% |
| Yakama | 0.0 /100 | #328 | Tragic 8.4% |
| Hopi | 0.0 /100 | #329 | Tragic 8.5% |
| Inupiat | 0.0 /100 | #330 | Tragic 8.5% |
| Sioux | 0.0 /100 | #331 | Tragic 8.5% |
| U.S. Virgin Islanders | 0.0 /100 | #332 | Tragic 8.6% |
| Liberians | 0.0 /100 | #333 | Tragic 8.6% |
| Immigrants | Liberia | 0.0 /100 | #334 | Tragic 8.7% |
| Immigrants | Dominica | 0.0 /100 | #335 | Tragic 8.7% |
| Puerto Ricans | 0.0 /100 | #336 | Tragic 8.7% |
| Navajo | 0.0 /100 | #337 | Tragic 8.8% |
| Cape Verdeans | 0.0 /100 | #338 | Tragic 8.9% |
Demographics Similar to Immigrants from Barbados by Single Mother Households
In terms of single mother households, the demographic groups most similar to Immigrants from Barbados are Colville (8.0%, a difference of 0.070%), Native/Alaskan (8.0%, a difference of 0.12%), Immigrants from St. Vincent and the Grenadines (8.0%, a difference of 0.24%), Immigrants from Central America (8.1%, a difference of 0.26%), and Immigrants from Bahamas (8.0%, a difference of 0.56%).
| Demographics | Rating | Rank | Single Mother Households |
| Houma | 0.0 /100 | #299 | Tragic 7.9% |
| Mexicans | 0.0 /100 | #300 | Tragic 8.0% |
| Chippewa | 0.0 /100 | #301 | Tragic 8.0% |
| Immigrants | Ghana | 0.0 /100 | #302 | Tragic 8.0% |
| Immigrants | Bahamas | 0.0 /100 | #303 | Tragic 8.0% |
| Natives/Alaskans | 0.0 /100 | #304 | Tragic 8.0% |
| Colville | 0.0 /100 | #305 | Tragic 8.0% |
| Immigrants | Barbados | 0.0 /100 | #306 | Tragic 8.0% |
| Immigrants | St. Vincent and the Grenadines | 0.0 /100 | #307 | Tragic 8.0% |
| Immigrants | Central America | 0.0 /100 | #308 | Tragic 8.1% |
| Cheyenne | 0.0 /100 | #309 | Tragic 8.1% |
| Hondurans | 0.0 /100 | #310 | Tragic 8.1% |
| Immigrants | Congo | 0.0 /100 | #311 | Tragic 8.1% |
| Bangladeshis | 0.0 /100 | #312 | Tragic 8.1% |
| Immigrants | Grenada | 0.0 /100 | #313 | Tragic 8.2% |