Sioux vs Immigrants from Poland Cognitive Disability
COMPARE
Sioux
Immigrants from Poland
Cognitive Disability
Cognitive Disability Comparison
Sioux
Immigrants from Poland
17.3%
COGNITIVE DISABILITY
48.6/ 100
METRIC RATING
179th/ 347
METRIC RANK
16.1%
COGNITIVE DISABILITY
100.0/ 100
METRIC RATING
8th/ 347
METRIC RANK
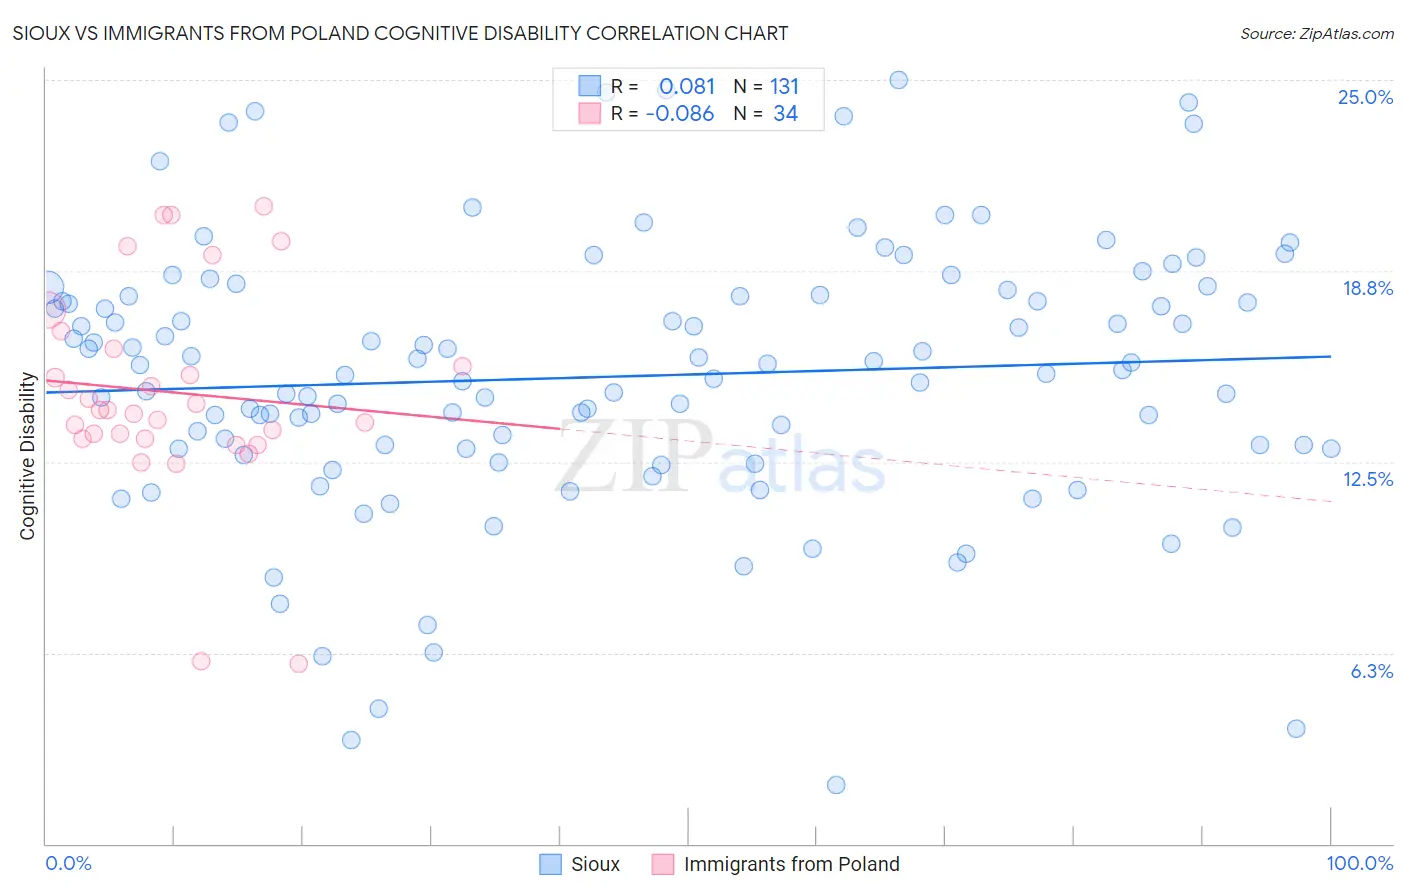
Sioux vs Immigrants from Poland Cognitive Disability Correlation Chart
The statistical analysis conducted on geographies consisting of 234,153,820 people shows a slight positive correlation between the proportion of Sioux and percentage of population with cognitive disability in the United States with a correlation coefficient (R) of 0.081 and weighted average of 17.3%. Similarly, the statistical analysis conducted on geographies consisting of 304,838,376 people shows a slight negative correlation between the proportion of Immigrants from Poland and percentage of population with cognitive disability in the United States with a correlation coefficient (R) of -0.086 and weighted average of 16.1%, a difference of 7.1%.
Cognitive Disability Correlation Summary
| Measurement | Sioux | Immigrants from Poland |
| Minimum | 1.9% | 5.9% |
| Maximum | 25.0% | 20.9% |
| Range | 23.1% | 15.0% |
| Mean | 15.3% | 14.8% |
| Median | 15.5% | 14.2% |
| Interquartile 25% (IQ1) | 12.9% | 13.3% |
| Interquartile 75% (IQ3) | 17.9% | 16.2% |
| Interquartile Range (IQR) | 5.0% | 2.9% |
| Standard Deviation (Sample) | 4.4% | 3.4% |
| Standard Deviation (Population) | 4.4% | 3.3% |
Similar Demographics by Cognitive Disability
Demographics Similar to Sioux by Cognitive Disability
In terms of cognitive disability, the demographic groups most similar to Sioux are Ute (17.3%, a difference of 0.010%), Spanish (17.3%, a difference of 0.010%), Shoshone (17.3%, a difference of 0.020%), Tsimshian (17.3%, a difference of 0.030%), and Laotian (17.3%, a difference of 0.040%).
| Demographics | Rating | Rank | Cognitive Disability |
| Immigrants | Turkey | 56.7 /100 | #172 | Average 17.2% |
| Immigrants | Northern Africa | 50.2 /100 | #173 | Average 17.3% |
| Laotians | 50.0 /100 | #174 | Average 17.3% |
| Tsimshian | 49.8 /100 | #175 | Average 17.3% |
| Shoshone | 49.2 /100 | #176 | Average 17.3% |
| Ute | 49.1 /100 | #177 | Average 17.3% |
| Spanish | 48.9 /100 | #178 | Average 17.3% |
| Sioux | 48.6 /100 | #179 | Average 17.3% |
| Pakistanis | 43.9 /100 | #180 | Average 17.3% |
| Immigrants | Guyana | 42.9 /100 | #181 | Average 17.3% |
| Arabs | 42.8 /100 | #182 | Average 17.3% |
| Spaniards | 40.3 /100 | #183 | Average 17.3% |
| Crow | 39.1 /100 | #184 | Fair 17.3% |
| Afghans | 38.2 /100 | #185 | Fair 17.3% |
| Cambodians | 35.9 /100 | #186 | Fair 17.3% |
Demographics Similar to Immigrants from Poland by Cognitive Disability
In terms of cognitive disability, the demographic groups most similar to Immigrants from Poland are Immigrants from Ireland (16.1%, a difference of 0.020%), Thai (16.1%, a difference of 0.13%), Assyrian/Chaldean/Syriac (16.2%, a difference of 0.32%), Immigrants from Scotland (16.2%, a difference of 0.36%), and Immigrants from Czechoslovakia (16.2%, a difference of 0.45%).
| Demographics | Rating | Rank | Cognitive Disability |
| Immigrants | Taiwan | 100.0 /100 | #1 | Exceptional 15.7% |
| Immigrants | India | 100.0 /100 | #2 | Exceptional 15.9% |
| Chinese | 100.0 /100 | #3 | Exceptional 15.9% |
| Immigrants | Lithuania | 100.0 /100 | #4 | Exceptional 16.0% |
| Immigrants | Hong Kong | 100.0 /100 | #5 | Exceptional 16.0% |
| Thais | 100.0 /100 | #6 | Exceptional 16.1% |
| Immigrants | Ireland | 100.0 /100 | #7 | Exceptional 16.1% |
| Immigrants | Poland | 100.0 /100 | #8 | Exceptional 16.1% |
| Assyrians/Chaldeans/Syriacs | 100.0 /100 | #9 | Exceptional 16.2% |
| Immigrants | Scotland | 100.0 /100 | #10 | Exceptional 16.2% |
| Immigrants | Czechoslovakia | 100.0 /100 | #11 | Exceptional 16.2% |
| Maltese | 100.0 /100 | #12 | Exceptional 16.2% |
| Lithuanians | 100.0 /100 | #13 | Exceptional 16.3% |
| Immigrants | Austria | 100.0 /100 | #14 | Exceptional 16.3% |
| Immigrants | Greece | 100.0 /100 | #15 | Exceptional 16.3% |