Sioux vs Immigrants from Dominica Married-couple Households
COMPARE
Sioux
Immigrants from Dominica
Married-couple Households
Married-couple Households Comparison
Sioux
Immigrants from Dominica
41.5%
MARRIED-COUPLE HOUSEHOLDS
0.0/ 100
METRIC RATING
305th/ 347
METRIC RANK
39.4%
MARRIED-COUPLE HOUSEHOLDS
0.0/ 100
METRIC RATING
329th/ 347
METRIC RANK
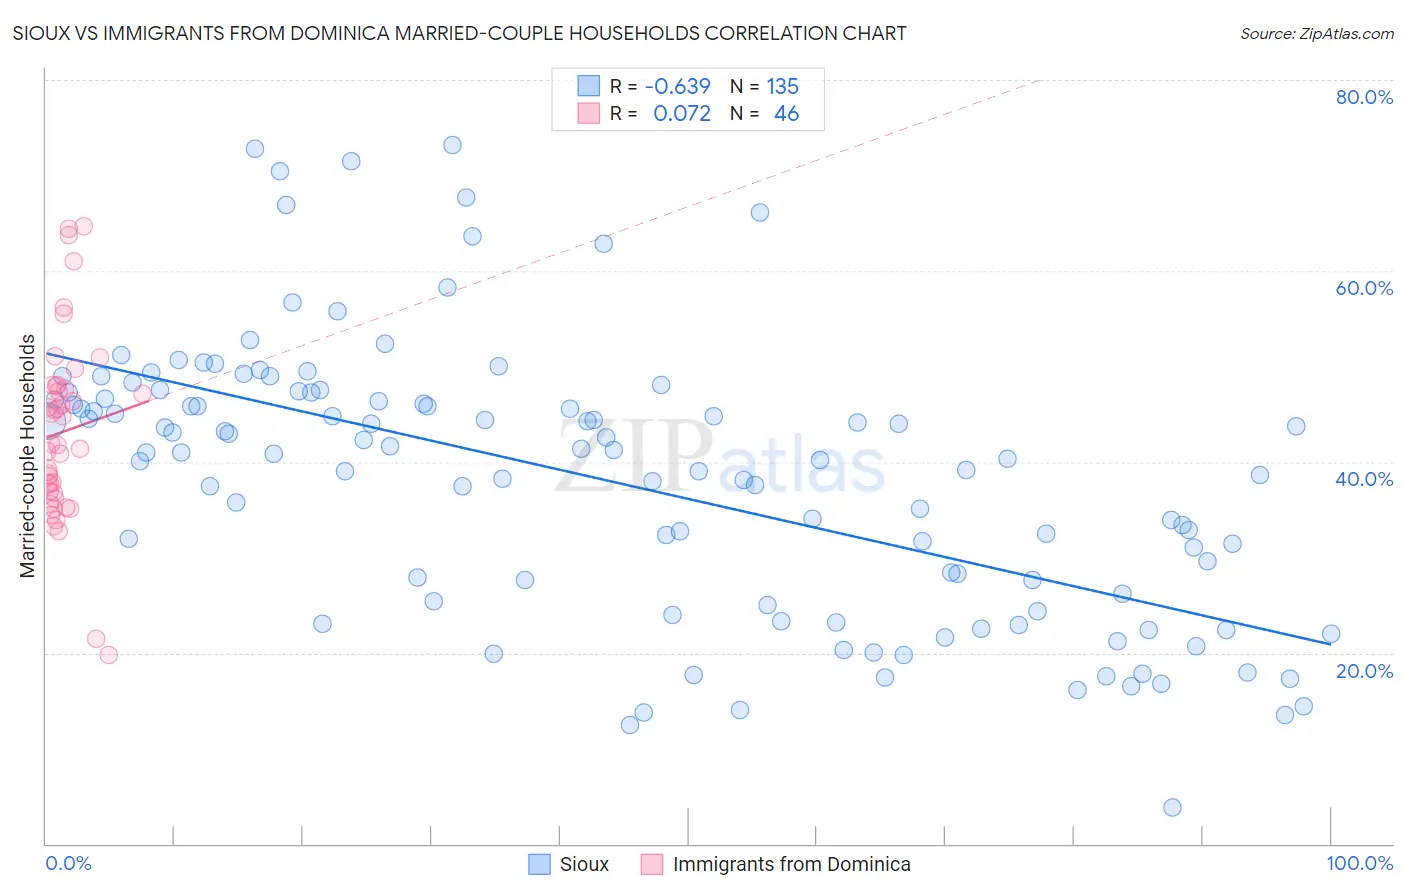
Sioux vs Immigrants from Dominica Married-couple Households Correlation Chart
The statistical analysis conducted on geographies consisting of 234,109,143 people shows a significant negative correlation between the proportion of Sioux and percentage of married-couple family households in the United States with a correlation coefficient (R) of -0.639 and weighted average of 41.5%. Similarly, the statistical analysis conducted on geographies consisting of 83,789,752 people shows a slight positive correlation between the proportion of Immigrants from Dominica and percentage of married-couple family households in the United States with a correlation coefficient (R) of 0.072 and weighted average of 39.4%, a difference of 5.4%.
Married-couple Households Correlation Summary
| Measurement | Sioux | Immigrants from Dominica |
| Minimum | 3.8% | 19.7% |
| Maximum | 73.2% | 64.7% |
| Range | 69.4% | 45.0% |
| Mean | 38.1% | 43.2% |
| Median | 40.9% | 41.9% |
| Interquartile 25% (IQ1) | 25.5% | 36.7% |
| Interquartile 75% (IQ3) | 46.7% | 48.0% |
| Interquartile Range (IQR) | 21.2% | 11.2% |
| Standard Deviation (Sample) | 14.3% | 9.7% |
| Standard Deviation (Population) | 14.3% | 9.6% |
Similar Demographics by Married-couple Households
Demographics Similar to Sioux by Married-couple Households
In terms of married-couple households, the demographic groups most similar to Sioux are Immigrants from Guyana (41.6%, a difference of 0.11%), Subsaharan African (41.6%, a difference of 0.22%), Immigrants from Honduras (41.6%, a difference of 0.23%), Guyanese (41.4%, a difference of 0.37%), and Immigrants from Western Africa (41.4%, a difference of 0.38%).
| Demographics | Rating | Rank | Married-couple Households |
| Immigrants | Middle Africa | 0.0 /100 | #298 | Tragic 41.8% |
| Immigrants | Ghana | 0.0 /100 | #299 | Tragic 41.8% |
| Immigrants | Belize | 0.0 /100 | #300 | Tragic 41.8% |
| Immigrants | Bahamas | 0.0 /100 | #301 | Tragic 41.7% |
| Immigrants | Honduras | 0.0 /100 | #302 | Tragic 41.6% |
| Sub-Saharan Africans | 0.0 /100 | #303 | Tragic 41.6% |
| Immigrants | Guyana | 0.0 /100 | #304 | Tragic 41.6% |
| Sioux | 0.0 /100 | #305 | Tragic 41.5% |
| Guyanese | 0.0 /100 | #306 | Tragic 41.4% |
| Immigrants | Western Africa | 0.0 /100 | #307 | Tragic 41.4% |
| Crow | 0.0 /100 | #308 | Tragic 41.4% |
| Immigrants | Trinidad and Tobago | 0.0 /100 | #309 | Tragic 41.2% |
| Haitians | 0.0 /100 | #310 | Tragic 41.2% |
| Colville | 0.0 /100 | #311 | Tragic 41.0% |
| Africans | 0.0 /100 | #312 | Tragic 40.9% |
Demographics Similar to Immigrants from Dominica by Married-couple Households
In terms of married-couple households, the demographic groups most similar to Immigrants from Dominica are Barbadian (39.4%, a difference of 0.080%), Immigrants from Barbados (39.2%, a difference of 0.44%), Lumbee (39.6%, a difference of 0.57%), Immigrants from Congo (39.0%, a difference of 0.88%), and Somali (39.0%, a difference of 0.96%).
| Demographics | Rating | Rank | Married-couple Households |
| Immigrants | Zaire | 0.0 /100 | #322 | Tragic 40.1% |
| Puerto Ricans | 0.0 /100 | #323 | Tragic 40.1% |
| Navajo | 0.0 /100 | #324 | Tragic 40.1% |
| Pueblo | 0.0 /100 | #325 | Tragic 40.0% |
| U.S. Virgin Islanders | 0.0 /100 | #326 | Tragic 39.8% |
| Lumbee | 0.0 /100 | #327 | Tragic 39.6% |
| Barbadians | 0.0 /100 | #328 | Tragic 39.4% |
| Immigrants | Dominica | 0.0 /100 | #329 | Tragic 39.4% |
| Immigrants | Barbados | 0.0 /100 | #330 | Tragic 39.2% |
| Immigrants | Congo | 0.0 /100 | #331 | Tragic 39.0% |
| Somalis | 0.0 /100 | #332 | Tragic 39.0% |
| Immigrants | West Indies | 0.0 /100 | #333 | Tragic 39.0% |
| Immigrants | St. Vincent and the Grenadines | 0.0 /100 | #334 | Tragic 38.7% |
| Senegalese | 0.0 /100 | #335 | Tragic 38.6% |
| Blacks/African Americans | 0.0 /100 | #336 | Tragic 38.5% |