Sioux vs Immigrants from Dominica Median Family Income
COMPARE
Sioux
Immigrants from Dominica
Median Family Income
Median Family Income Comparison
Sioux
Immigrants from Dominica
$82,386
MEDIAN FAMILY INCOME
0.0/ 100
METRIC RATING
325th/ 347
METRIC RANK
$85,411
MEDIAN FAMILY INCOME
0.0/ 100
METRIC RATING
306th/ 347
METRIC RANK
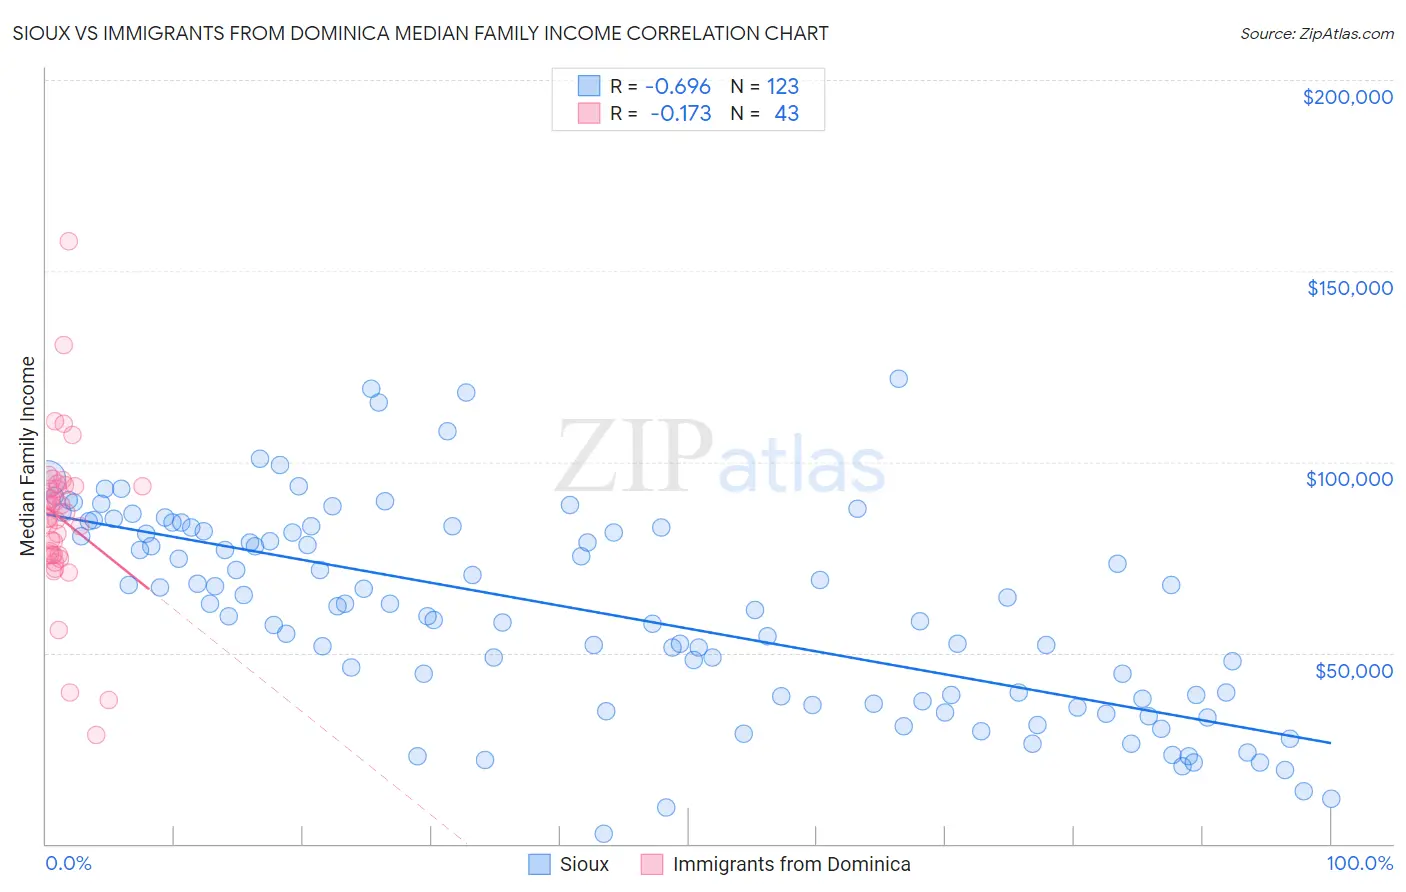
Sioux vs Immigrants from Dominica Median Family Income Correlation Chart
The statistical analysis conducted on geographies consisting of 234,054,236 people shows a significant negative correlation between the proportion of Sioux and median family income in the United States with a correlation coefficient (R) of -0.696 and weighted average of $82,386. Similarly, the statistical analysis conducted on geographies consisting of 83,779,139 people shows a poor negative correlation between the proportion of Immigrants from Dominica and median family income in the United States with a correlation coefficient (R) of -0.173 and weighted average of $85,411, a difference of 3.7%.
Median Family Income Correlation Summary
| Measurement | Sioux | Immigrants from Dominica |
| Minimum | $2,499 | $28,616 |
| Maximum | $121,875 | $157,838 |
| Range | $119,376 | $129,222 |
| Mean | $60,906 | $84,989 |
| Median | $62,832 | $85,349 |
| Interquartile 25% (IQ1) | $37,821 | $75,527 |
| Interquartile 75% (IQ3) | $82,841 | $93,750 |
| Interquartile Range (IQR) | $45,020 | $18,223 |
| Standard Deviation (Sample) | $26,471 | $21,651 |
| Standard Deviation (Population) | $26,363 | $21,398 |
Demographics Similar to Sioux and Immigrants from Dominica by Median Family Income
In terms of median family income, the demographic groups most similar to Sioux are Creek ($82,560, a difference of 0.21%), Bahamian ($82,631, a difference of 0.30%), Dominican ($82,888, a difference of 0.61%), Immigrants from Caribbean ($83,319, a difference of 1.1%), and Seminole ($83,354, a difference of 1.2%). Similarly, the demographic groups most similar to Immigrants from Dominica are Paiute ($85,414, a difference of 0.0%), Chickasaw ($85,356, a difference of 0.060%), U.S. Virgin Islander ($85,294, a difference of 0.14%), Haitian ($85,218, a difference of 0.23%), and Immigrants from Central America ($85,050, a difference of 0.42%).
| Demographics | Rating | Rank | Median Family Income |
| Paiute | 0.0 /100 | #305 | Tragic $85,414 |
| Immigrants | Dominica | 0.0 /100 | #306 | Tragic $85,411 |
| Chickasaw | 0.0 /100 | #307 | Tragic $85,356 |
| U.S. Virgin Islanders | 0.0 /100 | #308 | Tragic $85,294 |
| Haitians | 0.0 /100 | #309 | Tragic $85,218 |
| Immigrants | Central America | 0.0 /100 | #310 | Tragic $85,050 |
| Hondurans | 0.0 /100 | #311 | Tragic $85,004 |
| Cubans | 0.0 /100 | #312 | Tragic $84,981 |
| Choctaw | 0.0 /100 | #313 | Tragic $84,835 |
| Immigrants | Bahamas | 0.0 /100 | #314 | Tragic $84,732 |
| Apache | 0.0 /100 | #315 | Tragic $84,451 |
| Immigrants | Haiti | 0.0 /100 | #316 | Tragic $84,018 |
| Yakama | 0.0 /100 | #317 | Tragic $83,932 |
| Immigrants | Mexico | 0.0 /100 | #318 | Tragic $83,639 |
| Immigrants | Honduras | 0.0 /100 | #319 | Tragic $83,618 |
| Seminole | 0.0 /100 | #320 | Tragic $83,354 |
| Immigrants | Caribbean | 0.0 /100 | #321 | Tragic $83,319 |
| Dominicans | 0.0 /100 | #322 | Tragic $82,888 |
| Bahamians | 0.0 /100 | #323 | Tragic $82,631 |
| Creek | 0.0 /100 | #324 | Tragic $82,560 |
| Sioux | 0.0 /100 | #325 | Tragic $82,386 |