Sioux vs Immigrants from Barbados 7th Grade
COMPARE
Sioux
Immigrants from Barbados
7th Grade
7th Grade Comparison
Sioux
Immigrants from Barbados
97.4%
7TH GRADE
100.0/ 100
METRIC RATING
28th/ 347
METRIC RANK
95.0%
7TH GRADE
0.1/ 100
METRIC RATING
283rd/ 347
METRIC RANK
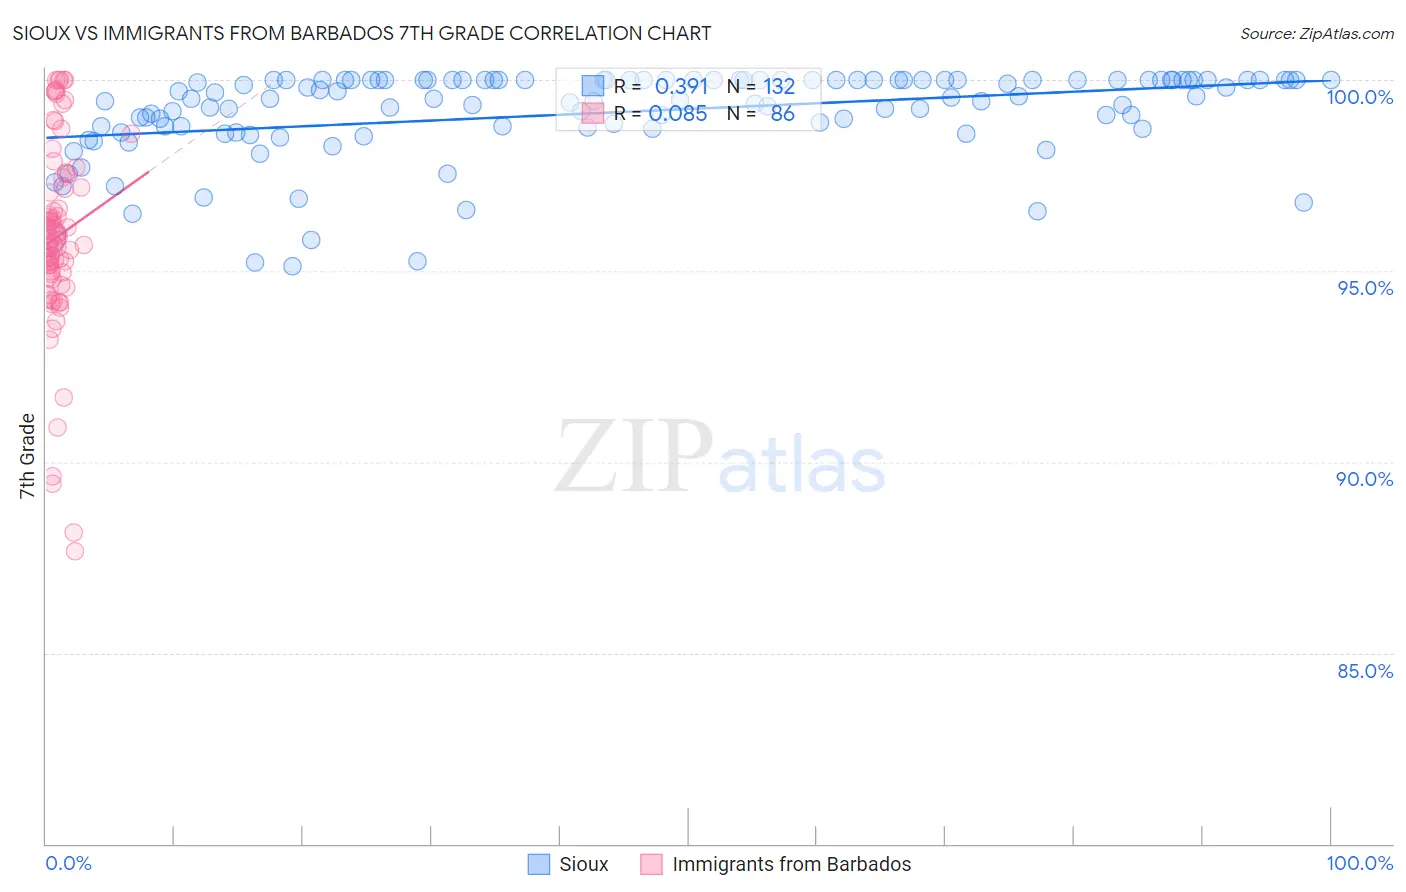
Sioux vs Immigrants from Barbados 7th Grade Correlation Chart
The statistical analysis conducted on geographies consisting of 234,197,525 people shows a mild positive correlation between the proportion of Sioux and percentage of population with at least 7th grade education in the United States with a correlation coefficient (R) of 0.391 and weighted average of 97.4%. Similarly, the statistical analysis conducted on geographies consisting of 112,787,165 people shows a slight positive correlation between the proportion of Immigrants from Barbados and percentage of population with at least 7th grade education in the United States with a correlation coefficient (R) of 0.085 and weighted average of 95.0%, a difference of 2.5%.
7th Grade Correlation Summary
| Measurement | Sioux | Immigrants from Barbados |
| Minimum | 95.1% | 87.6% |
| Maximum | 100.0% | 100.0% |
| Range | 4.9% | 12.4% |
| Mean | 99.1% | 95.9% |
| Median | 99.5% | 95.8% |
| Interquartile 25% (IQ1) | 98.8% | 94.9% |
| Interquartile 75% (IQ3) | 100.0% | 97.2% |
| Interquartile Range (IQR) | 1.2% | 2.3% |
| Standard Deviation (Sample) | 1.2% | 2.5% |
| Standard Deviation (Population) | 1.2% | 2.5% |
Similar Demographics by 7th Grade
Demographics Similar to Sioux by 7th Grade
In terms of 7th grade, the demographic groups most similar to Sioux are Scandinavian (97.4%, a difference of 0.0%), Czech (97.4%, a difference of 0.010%), Scotch-Irish (97.4%, a difference of 0.020%), Danish (97.4%, a difference of 0.020%), and Welsh (97.4%, a difference of 0.030%).
| Demographics | Rating | Rank | 7th Grade |
| Inupiat | 100.0 /100 | #21 | Exceptional 97.4% |
| French Canadians | 100.0 /100 | #22 | Exceptional 97.4% |
| Croatians | 100.0 /100 | #23 | Exceptional 97.4% |
| Welsh | 100.0 /100 | #24 | Exceptional 97.4% |
| French | 100.0 /100 | #25 | Exceptional 97.4% |
| Scotch-Irish | 100.0 /100 | #26 | Exceptional 97.4% |
| Danes | 100.0 /100 | #27 | Exceptional 97.4% |
| Sioux | 100.0 /100 | #28 | Exceptional 97.4% |
| Scandinavians | 100.0 /100 | #29 | Exceptional 97.4% |
| Czechs | 100.0 /100 | #30 | Exceptional 97.4% |
| Europeans | 100.0 /100 | #31 | Exceptional 97.3% |
| Italians | 100.0 /100 | #32 | Exceptional 97.3% |
| Chippewa | 100.0 /100 | #33 | Exceptional 97.3% |
| Alaska Natives | 100.0 /100 | #34 | Exceptional 97.3% |
| Swiss | 100.0 /100 | #35 | Exceptional 97.3% |
Demographics Similar to Immigrants from Barbados by 7th Grade
In terms of 7th grade, the demographic groups most similar to Immigrants from Barbados are Armenian (95.0%, a difference of 0.0%), Immigrants from Eritrea (94.9%, a difference of 0.010%), Immigrants from Bolivia (95.0%, a difference of 0.060%), Immigrants from St. Vincent and the Grenadines (95.0%, a difference of 0.070%), and Tohono O'odham (95.0%, a difference of 0.070%).
| Demographics | Rating | Rank | 7th Grade |
| Immigrants | Thailand | 0.2 /100 | #276 | Tragic 95.1% |
| Immigrants | Afghanistan | 0.2 /100 | #277 | Tragic 95.1% |
| Immigrants | Trinidad and Tobago | 0.1 /100 | #278 | Tragic 95.1% |
| Barbadians | 0.1 /100 | #279 | Tragic 95.1% |
| Immigrants | St. Vincent and the Grenadines | 0.1 /100 | #280 | Tragic 95.0% |
| Tohono O'odham | 0.1 /100 | #281 | Tragic 95.0% |
| Immigrants | Bolivia | 0.1 /100 | #282 | Tragic 95.0% |
| Immigrants | Barbados | 0.1 /100 | #283 | Tragic 95.0% |
| Armenians | 0.1 /100 | #284 | Tragic 95.0% |
| Immigrants | Eritrea | 0.1 /100 | #285 | Tragic 94.9% |
| Immigrants | Philippines | 0.0 /100 | #286 | Tragic 94.9% |
| Immigrants | Peru | 0.0 /100 | #287 | Tragic 94.9% |
| British West Indians | 0.0 /100 | #288 | Tragic 94.8% |
| Taiwanese | 0.0 /100 | #289 | Tragic 94.8% |
| Malaysians | 0.0 /100 | #290 | Tragic 94.8% |