Indonesian vs Immigrants from Barbados Single Mother Households
COMPARE
Indonesian
Immigrants from Barbados
Single Mother Households
Single Mother Households Comparison
Indonesians
Immigrants from Barbados
7.5%
SINGLE MOTHER HOUSEHOLDS
0.1/ 100
METRIC RATING
268th/ 347
METRIC RANK
8.0%
SINGLE MOTHER HOUSEHOLDS
0.0/ 100
METRIC RATING
306th/ 347
METRIC RANK
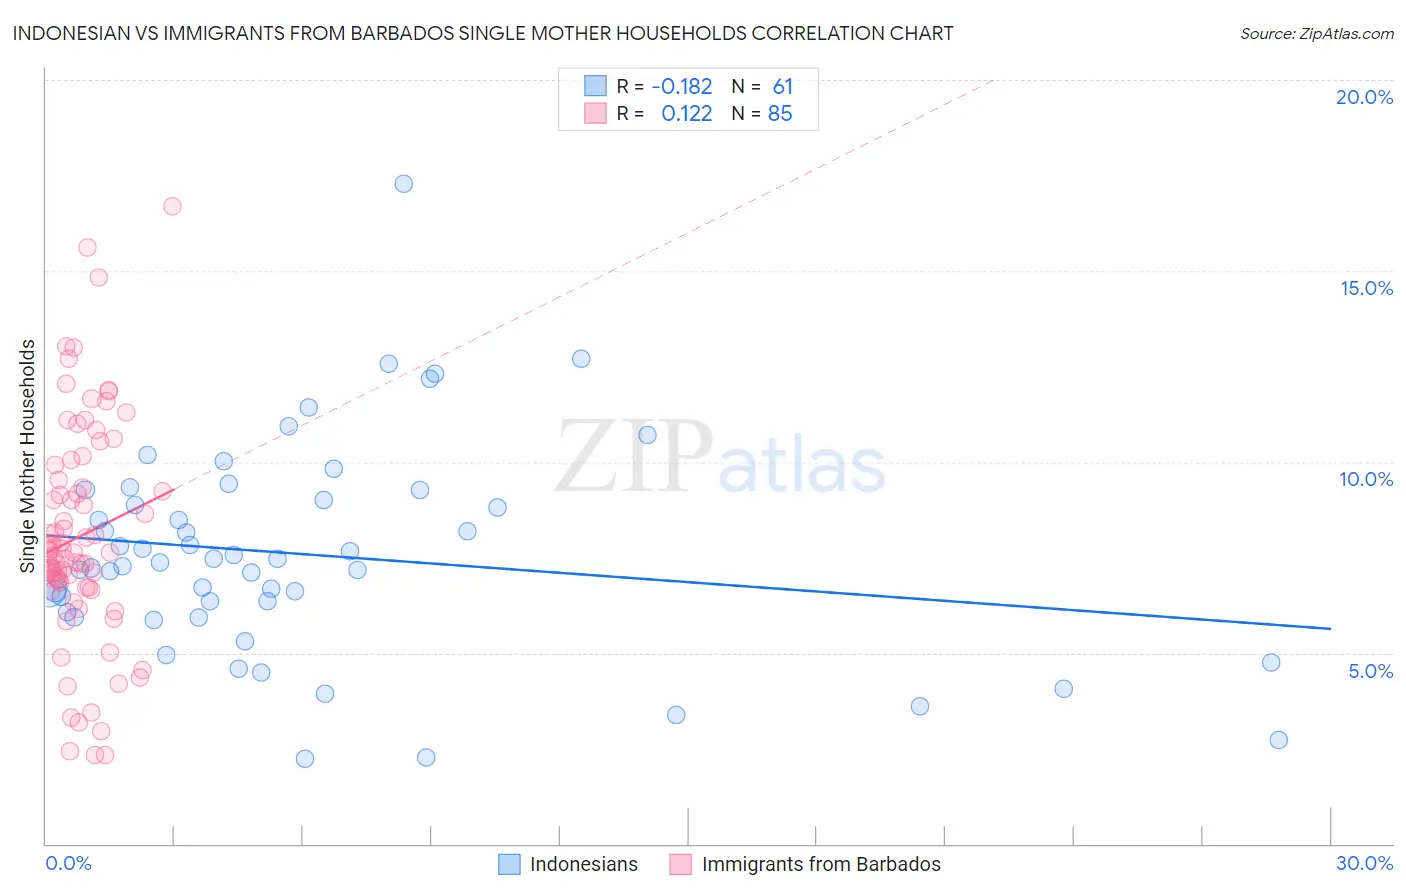
Indonesian vs Immigrants from Barbados Single Mother Households Correlation Chart
The statistical analysis conducted on geographies consisting of 162,449,880 people shows a poor negative correlation between the proportion of Indonesians and percentage of single mother households in the United States with a correlation coefficient (R) of -0.182 and weighted average of 7.5%. Similarly, the statistical analysis conducted on geographies consisting of 112,754,118 people shows a poor positive correlation between the proportion of Immigrants from Barbados and percentage of single mother households in the United States with a correlation coefficient (R) of 0.122 and weighted average of 8.0%, a difference of 7.3%.
Single Mother Households Correlation Summary
| Measurement | Indonesian | Immigrants from Barbados |
| Minimum | 2.2% | 2.3% |
| Maximum | 17.3% | 16.7% |
| Range | 15.0% | 14.4% |
| Mean | 7.6% | 8.1% |
| Median | 7.4% | 7.6% |
| Interquartile 25% (IQ1) | 6.0% | 6.7% |
| Interquartile 75% (IQ3) | 9.1% | 9.7% |
| Interquartile Range (IQR) | 3.1% | 3.0% |
| Standard Deviation (Sample) | 2.8% | 2.9% |
| Standard Deviation (Population) | 2.7% | 2.9% |
Similar Demographics by Single Mother Households
Demographics Similar to Indonesians by Single Mother Households
In terms of single mother households, the demographic groups most similar to Indonesians are Blackfeet (7.5%, a difference of 0.040%), Nepalese (7.5%, a difference of 0.38%), Somali (7.5%, a difference of 0.41%), Crow (7.4%, a difference of 0.48%), and Immigrants from Cuba (7.5%, a difference of 0.58%).
| Demographics | Rating | Rank | Single Mother Households |
| Japanese | 0.2 /100 | #261 | Tragic 7.4% |
| Immigrants | Somalia | 0.2 /100 | #262 | Tragic 7.4% |
| Immigrants | Nicaragua | 0.2 /100 | #263 | Tragic 7.4% |
| Yaqui | 0.1 /100 | #264 | Tragic 7.4% |
| Crow | 0.1 /100 | #265 | Tragic 7.4% |
| Nepalese | 0.1 /100 | #266 | Tragic 7.5% |
| Blackfeet | 0.1 /100 | #267 | Tragic 7.5% |
| Indonesians | 0.1 /100 | #268 | Tragic 7.5% |
| Somalis | 0.1 /100 | #269 | Tragic 7.5% |
| Immigrants | Cuba | 0.1 /100 | #270 | Tragic 7.5% |
| Salvadorans | 0.1 /100 | #271 | Tragic 7.5% |
| Immigrants | Azores | 0.1 /100 | #272 | Tragic 7.5% |
| Belizeans | 0.1 /100 | #273 | Tragic 7.6% |
| Immigrants | Guyana | 0.1 /100 | #274 | Tragic 7.6% |
| Central American Indians | 0.1 /100 | #275 | Tragic 7.6% |
Demographics Similar to Immigrants from Barbados by Single Mother Households
In terms of single mother households, the demographic groups most similar to Immigrants from Barbados are Colville (8.0%, a difference of 0.070%), Native/Alaskan (8.0%, a difference of 0.12%), Immigrants from St. Vincent and the Grenadines (8.0%, a difference of 0.24%), Immigrants from Central America (8.1%, a difference of 0.26%), and Immigrants from Bahamas (8.0%, a difference of 0.56%).
| Demographics | Rating | Rank | Single Mother Households |
| Houma | 0.0 /100 | #299 | Tragic 7.9% |
| Mexicans | 0.0 /100 | #300 | Tragic 8.0% |
| Chippewa | 0.0 /100 | #301 | Tragic 8.0% |
| Immigrants | Ghana | 0.0 /100 | #302 | Tragic 8.0% |
| Immigrants | Bahamas | 0.0 /100 | #303 | Tragic 8.0% |
| Natives/Alaskans | 0.0 /100 | #304 | Tragic 8.0% |
| Colville | 0.0 /100 | #305 | Tragic 8.0% |
| Immigrants | Barbados | 0.0 /100 | #306 | Tragic 8.0% |
| Immigrants | St. Vincent and the Grenadines | 0.0 /100 | #307 | Tragic 8.0% |
| Immigrants | Central America | 0.0 /100 | #308 | Tragic 8.1% |
| Cheyenne | 0.0 /100 | #309 | Tragic 8.1% |
| Hondurans | 0.0 /100 | #310 | Tragic 8.1% |
| Immigrants | Congo | 0.0 /100 | #311 | Tragic 8.1% |
| Bangladeshis | 0.0 /100 | #312 | Tragic 8.1% |
| Immigrants | Grenada | 0.0 /100 | #313 | Tragic 8.2% |