Samoan vs Immigrants from Barbados Single Mother Households
COMPARE
Samoan
Immigrants from Barbados
Single Mother Households
Single Mother Households Comparison
Samoans
Immigrants from Barbados
6.5%
SINGLE MOTHER HOUSEHOLDS
21.2/ 100
METRIC RATING
191st/ 347
METRIC RANK
8.0%
SINGLE MOTHER HOUSEHOLDS
0.0/ 100
METRIC RATING
306th/ 347
METRIC RANK
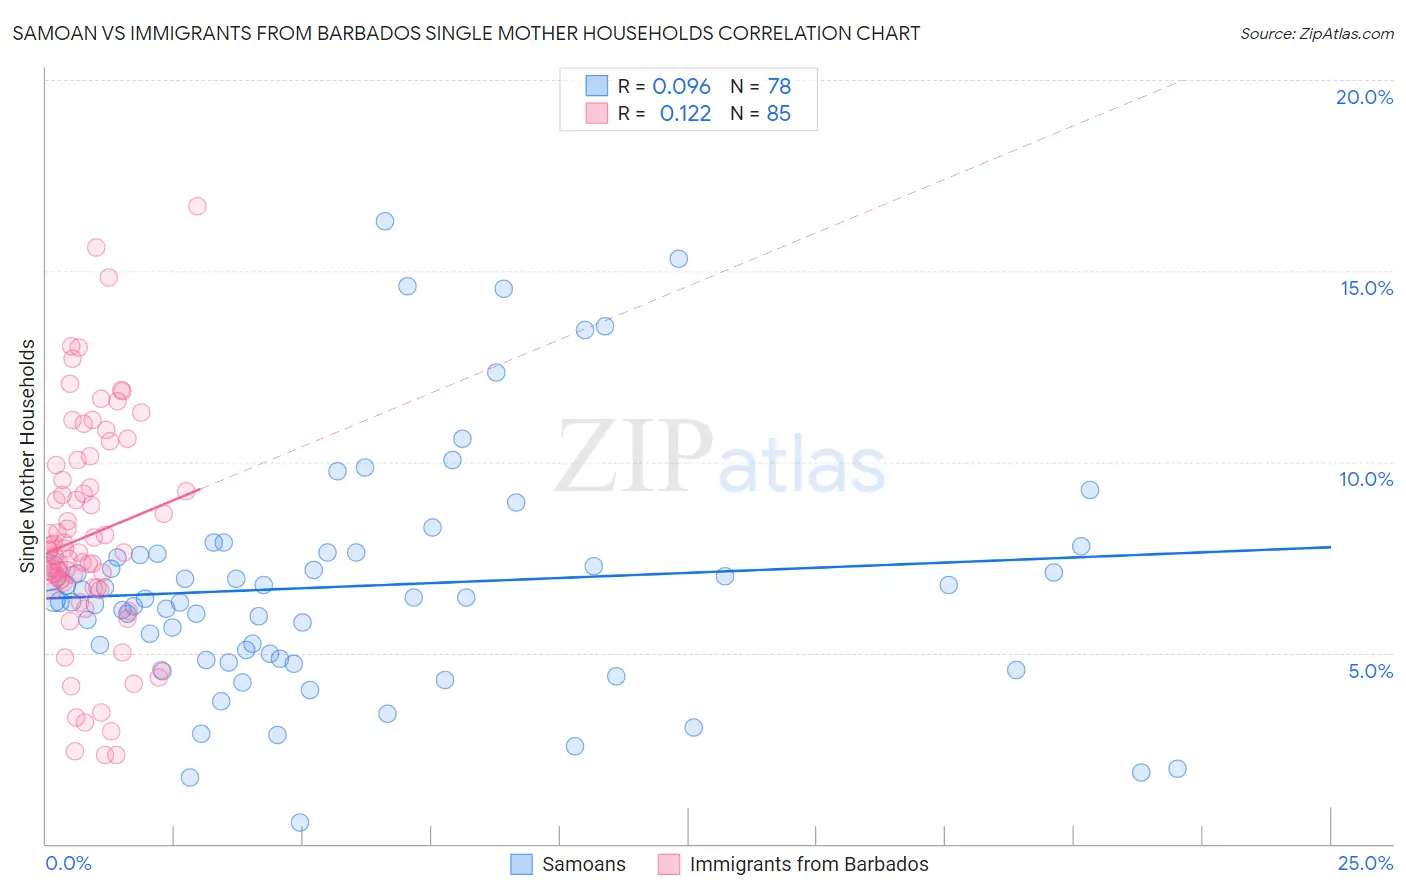
Samoan vs Immigrants from Barbados Single Mother Households Correlation Chart
The statistical analysis conducted on geographies consisting of 224,902,643 people shows a slight positive correlation between the proportion of Samoans and percentage of single mother households in the United States with a correlation coefficient (R) of 0.096 and weighted average of 6.5%. Similarly, the statistical analysis conducted on geographies consisting of 112,754,118 people shows a poor positive correlation between the proportion of Immigrants from Barbados and percentage of single mother households in the United States with a correlation coefficient (R) of 0.122 and weighted average of 8.0%, a difference of 22.9%.
Single Mother Households Correlation Summary
| Measurement | Samoan | Immigrants from Barbados |
| Minimum | 0.57% | 2.3% |
| Maximum | 16.3% | 16.7% |
| Range | 15.7% | 14.4% |
| Mean | 6.7% | 8.1% |
| Median | 6.4% | 7.6% |
| Interquartile 25% (IQ1) | 4.8% | 6.7% |
| Interquartile 75% (IQ3) | 7.6% | 9.7% |
| Interquartile Range (IQR) | 2.7% | 3.0% |
| Standard Deviation (Sample) | 3.1% | 2.9% |
| Standard Deviation (Population) | 3.1% | 2.9% |
Similar Demographics by Single Mother Households
Demographics Similar to Samoans by Single Mother Households
In terms of single mother households, the demographic groups most similar to Samoans are Peruvian (6.5%, a difference of 0.060%), Delaware (6.5%, a difference of 0.32%), American (6.6%, a difference of 0.37%), Ottawa (6.5%, a difference of 0.39%), and Colombian (6.6%, a difference of 0.49%).
| Demographics | Rating | Rank | Single Mother Households |
| Ethiopians | 26.0 /100 | #184 | Fair 6.5% |
| Ugandans | 25.6 /100 | #185 | Fair 6.5% |
| Costa Ricans | 24.8 /100 | #186 | Fair 6.5% |
| Immigrants | Afghanistan | 24.7 /100 | #187 | Fair 6.5% |
| Ottawa | 23.8 /100 | #188 | Fair 6.5% |
| Delaware | 23.3 /100 | #189 | Fair 6.5% |
| Peruvians | 21.6 /100 | #190 | Fair 6.5% |
| Samoans | 21.2 /100 | #191 | Fair 6.5% |
| Americans | 19.0 /100 | #192 | Poor 6.6% |
| Colombians | 18.3 /100 | #193 | Poor 6.6% |
| Immigrants | Uganda | 18.3 /100 | #194 | Poor 6.6% |
| South Americans | 18.0 /100 | #195 | Poor 6.6% |
| Uruguayans | 18.0 /100 | #196 | Poor 6.6% |
| Moroccans | 17.4 /100 | #197 | Poor 6.6% |
| Hawaiians | 16.1 /100 | #198 | Poor 6.6% |
Demographics Similar to Immigrants from Barbados by Single Mother Households
In terms of single mother households, the demographic groups most similar to Immigrants from Barbados are Colville (8.0%, a difference of 0.070%), Native/Alaskan (8.0%, a difference of 0.12%), Immigrants from St. Vincent and the Grenadines (8.0%, a difference of 0.24%), Immigrants from Central America (8.1%, a difference of 0.26%), and Immigrants from Bahamas (8.0%, a difference of 0.56%).
| Demographics | Rating | Rank | Single Mother Households |
| Houma | 0.0 /100 | #299 | Tragic 7.9% |
| Mexicans | 0.0 /100 | #300 | Tragic 8.0% |
| Chippewa | 0.0 /100 | #301 | Tragic 8.0% |
| Immigrants | Ghana | 0.0 /100 | #302 | Tragic 8.0% |
| Immigrants | Bahamas | 0.0 /100 | #303 | Tragic 8.0% |
| Natives/Alaskans | 0.0 /100 | #304 | Tragic 8.0% |
| Colville | 0.0 /100 | #305 | Tragic 8.0% |
| Immigrants | Barbados | 0.0 /100 | #306 | Tragic 8.0% |
| Immigrants | St. Vincent and the Grenadines | 0.0 /100 | #307 | Tragic 8.0% |
| Immigrants | Central America | 0.0 /100 | #308 | Tragic 8.1% |
| Cheyenne | 0.0 /100 | #309 | Tragic 8.1% |
| Hondurans | 0.0 /100 | #310 | Tragic 8.1% |
| Immigrants | Congo | 0.0 /100 | #311 | Tragic 8.1% |
| Bangladeshis | 0.0 /100 | #312 | Tragic 8.1% |
| Immigrants | Grenada | 0.0 /100 | #313 | Tragic 8.2% |