Indian (Asian) vs Immigrants from Barbados Single Mother Households
COMPARE
Indian (Asian)
Immigrants from Barbados
Single Mother Households
Single Mother Households Comparison
Indians (Asian)
Immigrants from Barbados
5.1%
SINGLE MOTHER HOUSEHOLDS
99.9/ 100
METRIC RATING
16th/ 347
METRIC RANK
8.0%
SINGLE MOTHER HOUSEHOLDS
0.0/ 100
METRIC RATING
306th/ 347
METRIC RANK
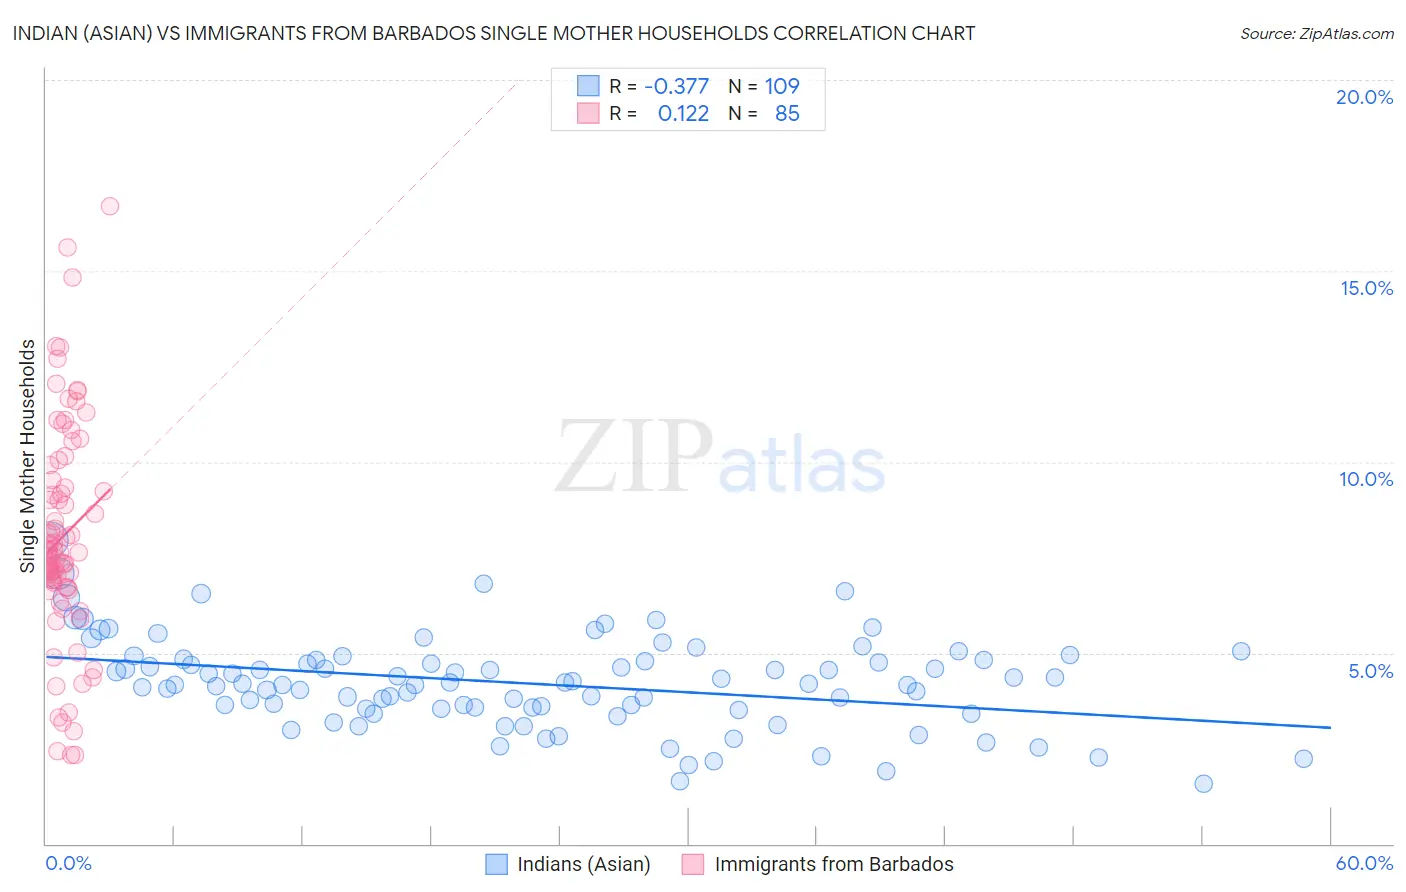
Indian (Asian) vs Immigrants from Barbados Single Mother Households Correlation Chart
The statistical analysis conducted on geographies consisting of 492,899,997 people shows a mild negative correlation between the proportion of Indians (Asian) and percentage of single mother households in the United States with a correlation coefficient (R) of -0.377 and weighted average of 5.1%. Similarly, the statistical analysis conducted on geographies consisting of 112,754,118 people shows a poor positive correlation between the proportion of Immigrants from Barbados and percentage of single mother households in the United States with a correlation coefficient (R) of 0.122 and weighted average of 8.0%, a difference of 57.3%.
Single Mother Households Correlation Summary
| Measurement | Indian (Asian) | Immigrants from Barbados |
| Minimum | 1.6% | 2.3% |
| Maximum | 7.9% | 16.7% |
| Range | 6.4% | 14.4% |
| Mean | 4.2% | 8.1% |
| Median | 4.2% | 7.6% |
| Interquartile 25% (IQ1) | 3.5% | 6.7% |
| Interquartile 75% (IQ3) | 4.8% | 9.7% |
| Interquartile Range (IQR) | 1.3% | 3.0% |
| Standard Deviation (Sample) | 1.2% | 2.9% |
| Standard Deviation (Population) | 1.2% | 2.9% |
Similar Demographics by Single Mother Households
Demographics Similar to Indians (Asian) by Single Mother Households
In terms of single mother households, the demographic groups most similar to Indians (Asian) are Immigrants from Eastern Asia (5.1%, a difference of 0.19%), Soviet Union (5.1%, a difference of 0.21%), Immigrants from Australia (5.1%, a difference of 0.28%), Immigrants from India (5.1%, a difference of 0.60%), and Cypriot (5.1%, a difference of 0.73%).
| Demographics | Rating | Rank | Single Mother Households |
| Okinawans | 99.9 /100 | #9 | Exceptional 5.0% |
| Immigrants | Israel | 99.9 /100 | #10 | Exceptional 5.0% |
| Immigrants | China | 99.9 /100 | #11 | Exceptional 5.1% |
| Cypriots | 99.9 /100 | #12 | Exceptional 5.1% |
| Immigrants | India | 99.9 /100 | #13 | Exceptional 5.1% |
| Immigrants | Australia | 99.9 /100 | #14 | Exceptional 5.1% |
| Immigrants | Eastern Asia | 99.9 /100 | #15 | Exceptional 5.1% |
| Indians (Asian) | 99.9 /100 | #16 | Exceptional 5.1% |
| Soviet Union | 99.9 /100 | #17 | Exceptional 5.1% |
| Immigrants | Armenia | 99.9 /100 | #18 | Exceptional 5.2% |
| Chinese | 99.9 /100 | #19 | Exceptional 5.2% |
| Maltese | 99.9 /100 | #20 | Exceptional 5.2% |
| Eastern Europeans | 99.8 /100 | #21 | Exceptional 5.2% |
| Thais | 99.8 /100 | #22 | Exceptional 5.2% |
| Immigrants | Austria | 99.8 /100 | #23 | Exceptional 5.2% |
Demographics Similar to Immigrants from Barbados by Single Mother Households
In terms of single mother households, the demographic groups most similar to Immigrants from Barbados are Colville (8.0%, a difference of 0.070%), Native/Alaskan (8.0%, a difference of 0.12%), Immigrants from St. Vincent and the Grenadines (8.0%, a difference of 0.24%), Immigrants from Central America (8.1%, a difference of 0.26%), and Immigrants from Bahamas (8.0%, a difference of 0.56%).
| Demographics | Rating | Rank | Single Mother Households |
| Houma | 0.0 /100 | #299 | Tragic 7.9% |
| Mexicans | 0.0 /100 | #300 | Tragic 8.0% |
| Chippewa | 0.0 /100 | #301 | Tragic 8.0% |
| Immigrants | Ghana | 0.0 /100 | #302 | Tragic 8.0% |
| Immigrants | Bahamas | 0.0 /100 | #303 | Tragic 8.0% |
| Natives/Alaskans | 0.0 /100 | #304 | Tragic 8.0% |
| Colville | 0.0 /100 | #305 | Tragic 8.0% |
| Immigrants | Barbados | 0.0 /100 | #306 | Tragic 8.0% |
| Immigrants | St. Vincent and the Grenadines | 0.0 /100 | #307 | Tragic 8.0% |
| Immigrants | Central America | 0.0 /100 | #308 | Tragic 8.1% |
| Cheyenne | 0.0 /100 | #309 | Tragic 8.1% |
| Hondurans | 0.0 /100 | #310 | Tragic 8.1% |
| Immigrants | Congo | 0.0 /100 | #311 | Tragic 8.1% |
| Bangladeshis | 0.0 /100 | #312 | Tragic 8.1% |
| Immigrants | Grenada | 0.0 /100 | #313 | Tragic 8.2% |