Sioux vs British Currently Married
COMPARE
Sioux
British
Currently Married
Currently Married Comparison
Sioux
British
41.9%
CURRENTLY MARRIED
0.0/ 100
METRIC RATING
303rd/ 347
METRIC RANK
48.8%
CURRENTLY MARRIED
99.4/ 100
METRIC RATING
39th/ 347
METRIC RANK
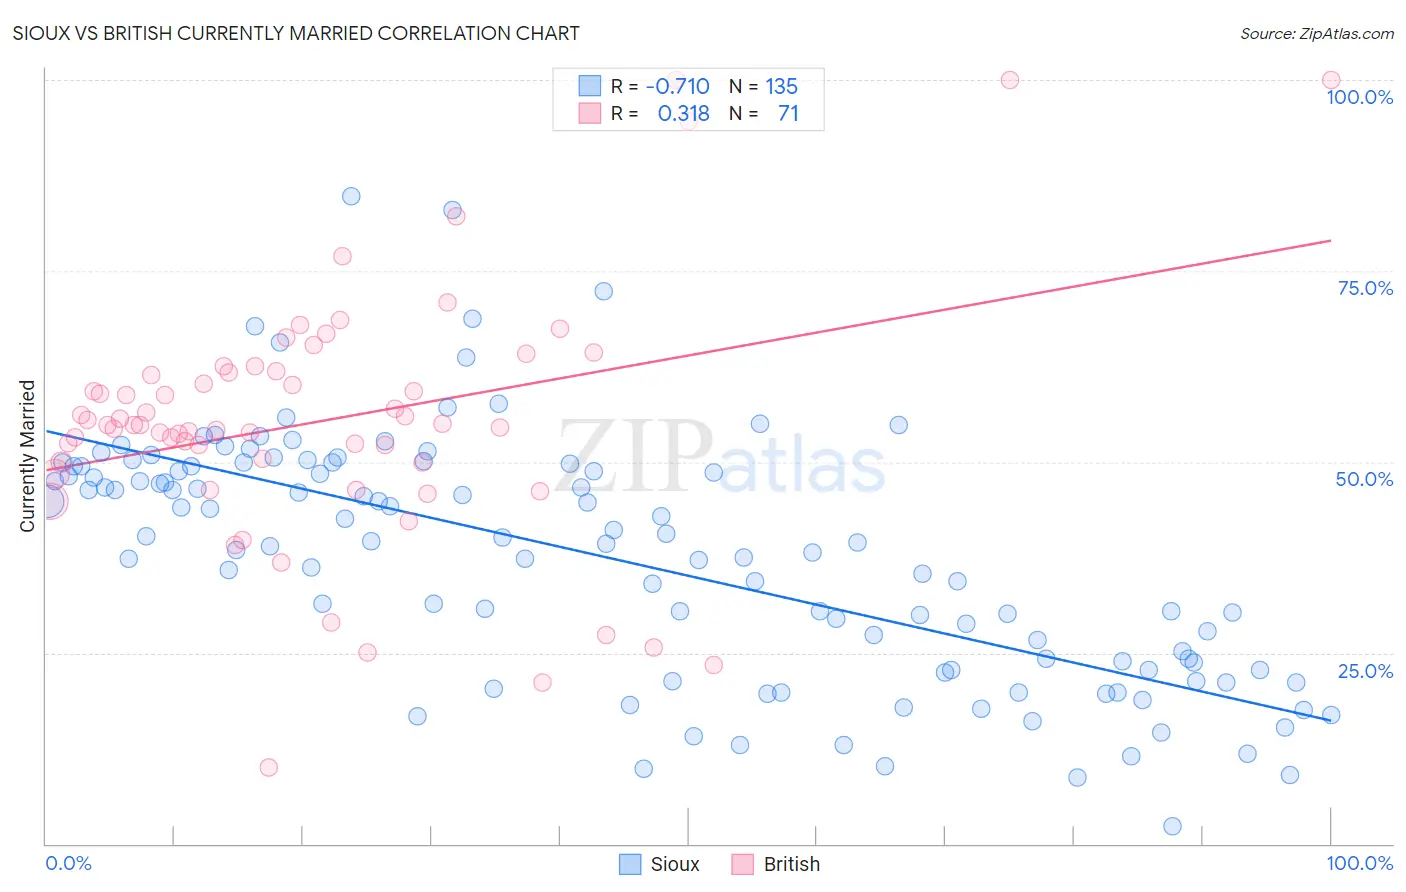
Sioux vs British Currently Married Correlation Chart
The statistical analysis conducted on geographies consisting of 234,188,920 people shows a strong negative correlation between the proportion of Sioux and percentage of population currently married in the United States with a correlation coefficient (R) of -0.710 and weighted average of 41.9%. Similarly, the statistical analysis conducted on geographies consisting of 531,372,263 people shows a mild positive correlation between the proportion of British and percentage of population currently married in the United States with a correlation coefficient (R) of 0.318 and weighted average of 48.8%, a difference of 16.3%.
Currently Married Correlation Summary
| Measurement | Sioux | British |
| Minimum | 2.3% | 10.0% |
| Maximum | 84.8% | 100.0% |
| Range | 82.5% | 90.0% |
| Mean | 37.5% | 55.4% |
| Median | 39.4% | 54.9% |
| Interquartile 25% (IQ1) | 22.8% | 50.0% |
| Interquartile 75% (IQ3) | 49.5% | 61.8% |
| Interquartile Range (IQR) | 26.7% | 11.8% |
| Standard Deviation (Sample) | 16.0% | 16.7% |
| Standard Deviation (Population) | 16.0% | 16.6% |
Similar Demographics by Currently Married
Demographics Similar to Sioux by Currently Married
In terms of currently married, the demographic groups most similar to Sioux are Immigrants from Zaire (42.0%, a difference of 0.010%), Immigrants from Bahamas (41.9%, a difference of 0.11%), Immigrants from Trinidad and Tobago (41.9%, a difference of 0.15%), Immigrants from Guyana (41.9%, a difference of 0.16%), and Immigrants from Yemen (42.1%, a difference of 0.26%).
| Demographics | Rating | Rank | Currently Married |
| Menominee | 0.0 /100 | #296 | Tragic 42.3% |
| Cheyenne | 0.0 /100 | #297 | Tragic 42.2% |
| Immigrants | Honduras | 0.0 /100 | #298 | Tragic 42.2% |
| Liberians | 0.0 /100 | #299 | Tragic 42.2% |
| Belizeans | 0.0 /100 | #300 | Tragic 42.2% |
| Immigrants | Yemen | 0.0 /100 | #301 | Tragic 42.1% |
| Immigrants | Zaire | 0.0 /100 | #302 | Tragic 42.0% |
| Sioux | 0.0 /100 | #303 | Tragic 41.9% |
| Immigrants | Bahamas | 0.0 /100 | #304 | Tragic 41.9% |
| Immigrants | Trinidad and Tobago | 0.0 /100 | #305 | Tragic 41.9% |
| Immigrants | Guyana | 0.0 /100 | #306 | Tragic 41.9% |
| Africans | 0.0 /100 | #307 | Tragic 41.8% |
| Immigrants | Belize | 0.0 /100 | #308 | Tragic 41.8% |
| Immigrants | Liberia | 0.0 /100 | #309 | Tragic 41.8% |
| Guyanese | 0.0 /100 | #310 | Tragic 41.6% |
Demographics Similar to British by Currently Married
In terms of currently married, the demographic groups most similar to British are Immigrants from Canada (48.8%, a difference of 0.020%), Czechoslovakian (48.8%, a difference of 0.030%), Greek (48.8%, a difference of 0.040%), Italian (48.8%, a difference of 0.070%), and Hungarian (48.8%, a difference of 0.070%).
| Demographics | Rating | Rank | Currently Married |
| Immigrants | Hong Kong | 99.5 /100 | #32 | Exceptional 48.9% |
| Irish | 99.5 /100 | #33 | Exceptional 48.9% |
| Immigrants | Lithuania | 99.4 /100 | #34 | Exceptional 48.8% |
| Immigrants | Northern Europe | 99.4 /100 | #35 | Exceptional 48.8% |
| Italians | 99.4 /100 | #36 | Exceptional 48.8% |
| Hungarians | 99.4 /100 | #37 | Exceptional 48.8% |
| Czechoslovakians | 99.4 /100 | #38 | Exceptional 48.8% |
| British | 99.4 /100 | #39 | Exceptional 48.8% |
| Immigrants | Canada | 99.4 /100 | #40 | Exceptional 48.8% |
| Greeks | 99.3 /100 | #41 | Exceptional 48.8% |
| Finns | 99.3 /100 | #42 | Exceptional 48.8% |
| Scotch-Irish | 99.3 /100 | #43 | Exceptional 48.7% |
| Immigrants | North America | 99.3 /100 | #44 | Exceptional 48.7% |
| Belgians | 99.3 /100 | #45 | Exceptional 48.7% |
| Immigrants | Iran | 99.2 /100 | #46 | Exceptional 48.7% |