Sioux vs Immigrants from El Salvador Currently Married
COMPARE
Sioux
Immigrants from El Salvador
Currently Married
Currently Married Comparison
Sioux
Immigrants from El Salvador
41.9%
CURRENTLY MARRIED
0.0/ 100
METRIC RATING
303rd/ 347
METRIC RANK
43.1%
CURRENTLY MARRIED
0.0/ 100
METRIC RATING
284th/ 347
METRIC RANK
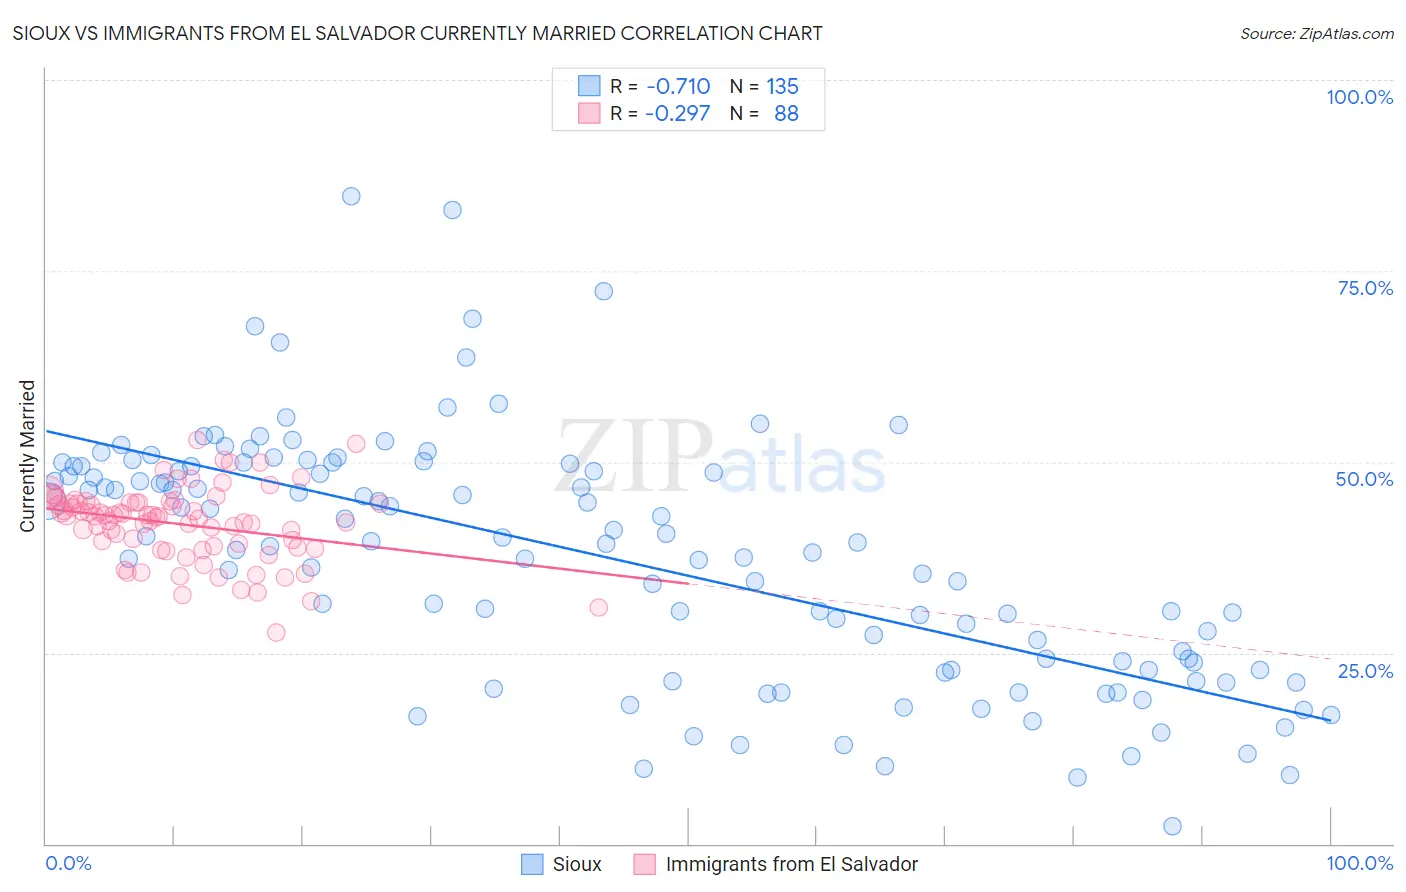
Sioux vs Immigrants from El Salvador Currently Married Correlation Chart
The statistical analysis conducted on geographies consisting of 234,188,920 people shows a strong negative correlation between the proportion of Sioux and percentage of population currently married in the United States with a correlation coefficient (R) of -0.710 and weighted average of 41.9%. Similarly, the statistical analysis conducted on geographies consisting of 357,815,519 people shows a weak negative correlation between the proportion of Immigrants from El Salvador and percentage of population currently married in the United States with a correlation coefficient (R) of -0.297 and weighted average of 43.1%, a difference of 2.9%.
Currently Married Correlation Summary
| Measurement | Sioux | Immigrants from El Salvador |
| Minimum | 2.3% | 27.7% |
| Maximum | 84.8% | 52.9% |
| Range | 82.5% | 25.1% |
| Mean | 37.5% | 41.9% |
| Median | 39.4% | 42.9% |
| Interquartile 25% (IQ1) | 22.8% | 38.9% |
| Interquartile 75% (IQ3) | 49.5% | 44.7% |
| Interquartile Range (IQR) | 26.7% | 5.8% |
| Standard Deviation (Sample) | 16.0% | 4.8% |
| Standard Deviation (Population) | 16.0% | 4.8% |
Demographics Similar to Sioux and Immigrants from El Salvador by Currently Married
In terms of currently married, the demographic groups most similar to Sioux are Immigrants from Zaire (42.0%, a difference of 0.010%), Immigrants from Yemen (42.1%, a difference of 0.26%), Belizean (42.2%, a difference of 0.50%), Liberian (42.2%, a difference of 0.59%), and Immigrants from Honduras (42.2%, a difference of 0.63%). Similarly, the demographic groups most similar to Immigrants from El Salvador are Kiowa (43.2%, a difference of 0.010%), Immigrants from Middle Africa (43.0%, a difference of 0.40%), Ghanaian (42.9%, a difference of 0.53%), Guatemalan (42.9%, a difference of 0.55%), and Native/Alaskan (42.8%, a difference of 0.82%).
| Demographics | Rating | Rank | Currently Married |
| Kiowa | 0.0 /100 | #283 | Tragic 43.2% |
| Immigrants | El Salvador | 0.0 /100 | #284 | Tragic 43.1% |
| Immigrants | Middle Africa | 0.0 /100 | #285 | Tragic 43.0% |
| Ghanaians | 0.0 /100 | #286 | Tragic 42.9% |
| Guatemalans | 0.0 /100 | #287 | Tragic 42.9% |
| Natives/Alaskans | 0.0 /100 | #288 | Tragic 42.8% |
| Paiute | 0.0 /100 | #289 | Tragic 42.7% |
| Immigrants | Ghana | 0.0 /100 | #290 | Tragic 42.7% |
| Immigrants | Guatemala | 0.0 /100 | #291 | Tragic 42.6% |
| Sub-Saharan Africans | 0.0 /100 | #292 | Tragic 42.6% |
| Yuman | 0.0 /100 | #293 | Tragic 42.6% |
| Hondurans | 0.0 /100 | #294 | Tragic 42.5% |
| Immigrants | Western Africa | 0.0 /100 | #295 | Tragic 42.4% |
| Menominee | 0.0 /100 | #296 | Tragic 42.3% |
| Cheyenne | 0.0 /100 | #297 | Tragic 42.2% |
| Immigrants | Honduras | 0.0 /100 | #298 | Tragic 42.2% |
| Liberians | 0.0 /100 | #299 | Tragic 42.2% |
| Belizeans | 0.0 /100 | #300 | Tragic 42.2% |
| Immigrants | Yemen | 0.0 /100 | #301 | Tragic 42.1% |
| Immigrants | Zaire | 0.0 /100 | #302 | Tragic 42.0% |
| Sioux | 0.0 /100 | #303 | Tragic 41.9% |