Immigrants from Turkey vs British Currently Married
COMPARE
Immigrants from Turkey
British
Currently Married
Currently Married Comparison
Immigrants from Turkey
British
47.0%
CURRENTLY MARRIED
70.0/ 100
METRIC RATING
150th/ 347
METRIC RANK
48.8%
CURRENTLY MARRIED
99.4/ 100
METRIC RATING
39th/ 347
METRIC RANK
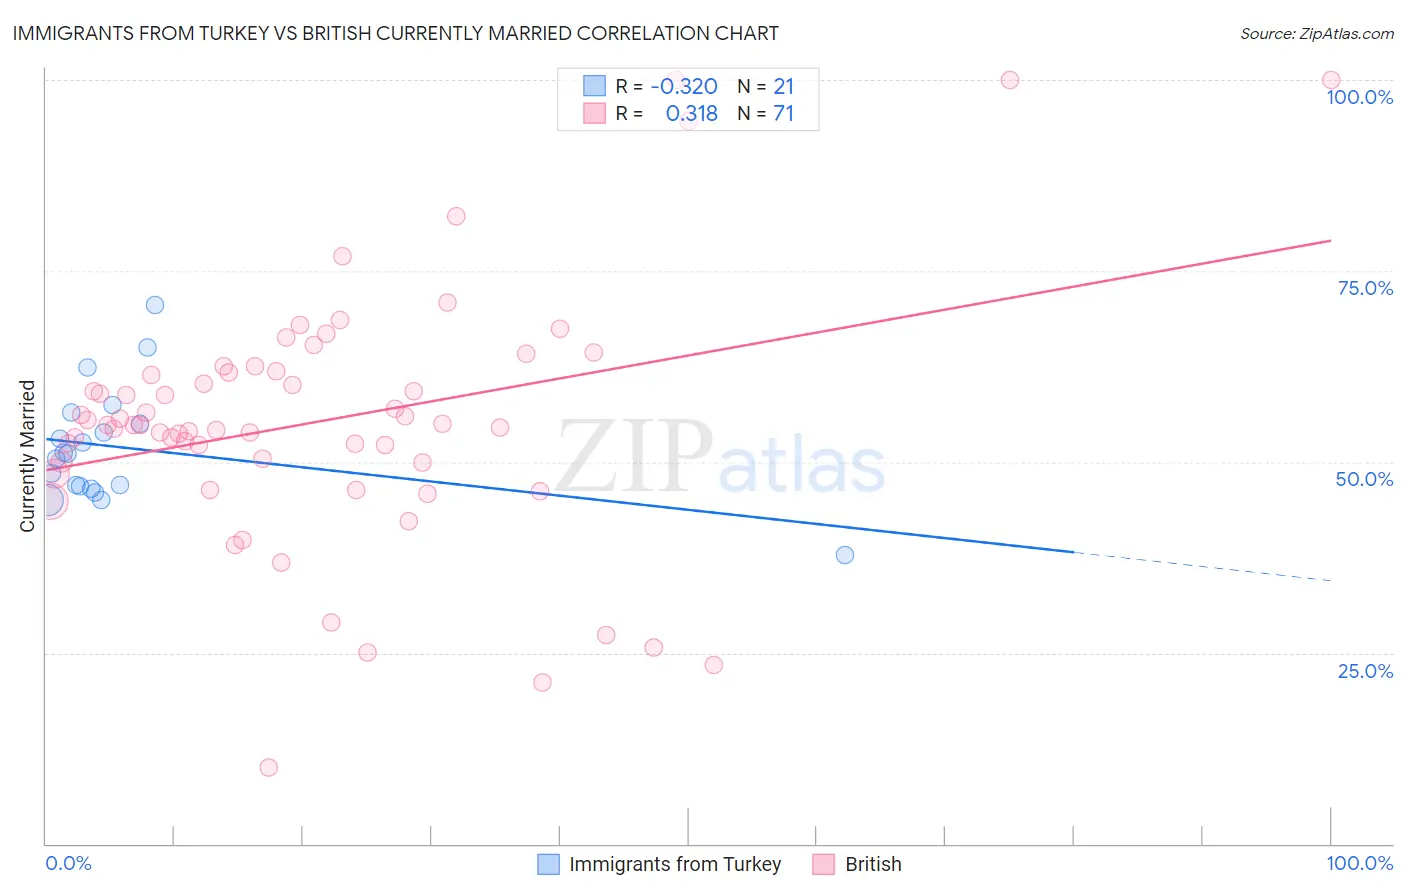
Immigrants from Turkey vs British Currently Married Correlation Chart
The statistical analysis conducted on geographies consisting of 223,037,239 people shows a mild negative correlation between the proportion of Immigrants from Turkey and percentage of population currently married in the United States with a correlation coefficient (R) of -0.320 and weighted average of 47.0%. Similarly, the statistical analysis conducted on geographies consisting of 531,372,263 people shows a mild positive correlation between the proportion of British and percentage of population currently married in the United States with a correlation coefficient (R) of 0.318 and weighted average of 48.8%, a difference of 3.8%.
Currently Married Correlation Summary
| Measurement | Immigrants from Turkey | British |
| Minimum | 37.8% | 10.0% |
| Maximum | 70.5% | 100.0% |
| Range | 32.7% | 90.0% |
| Mean | 51.8% | 55.4% |
| Median | 51.0% | 54.9% |
| Interquartile 25% (IQ1) | 46.7% | 50.0% |
| Interquartile 75% (IQ3) | 55.7% | 61.8% |
| Interquartile Range (IQR) | 9.0% | 11.8% |
| Standard Deviation (Sample) | 7.6% | 16.7% |
| Standard Deviation (Population) | 7.4% | 16.6% |
Similar Demographics by Currently Married
Demographics Similar to Immigrants from Turkey by Currently Married
In terms of currently married, the demographic groups most similar to Immigrants from Turkey are Zimbabwean (47.0%, a difference of 0.0%), Cambodian (47.0%, a difference of 0.010%), Chilean (47.0%, a difference of 0.010%), Immigrants from Serbia (47.0%, a difference of 0.050%), and Immigrants from Venezuela (47.0%, a difference of 0.060%).
| Demographics | Rating | Rank | Currently Married |
| Guamanians/Chamorros | 74.2 /100 | #143 | Good 47.1% |
| Hmong | 73.4 /100 | #144 | Good 47.1% |
| Immigrants | South Eastern Asia | 72.9 /100 | #145 | Good 47.1% |
| Carpatho Rusyns | 72.6 /100 | #146 | Good 47.0% |
| Immigrants | Argentina | 72.0 /100 | #147 | Good 47.0% |
| Cambodians | 70.4 /100 | #148 | Good 47.0% |
| Zimbabweans | 70.1 /100 | #149 | Good 47.0% |
| Immigrants | Turkey | 70.0 /100 | #150 | Good 47.0% |
| Chileans | 69.8 /100 | #151 | Good 47.0% |
| Immigrants | Serbia | 68.8 /100 | #152 | Good 47.0% |
| Immigrants | Venezuela | 68.6 /100 | #153 | Good 47.0% |
| Albanians | 68.6 /100 | #154 | Good 47.0% |
| Arabs | 68.6 /100 | #155 | Good 47.0% |
| Spanish | 68.1 /100 | #156 | Good 47.0% |
| Immigrants | Switzerland | 67.8 /100 | #157 | Good 46.9% |
Demographics Similar to British by Currently Married
In terms of currently married, the demographic groups most similar to British are Immigrants from Canada (48.8%, a difference of 0.020%), Czechoslovakian (48.8%, a difference of 0.030%), Greek (48.8%, a difference of 0.040%), Italian (48.8%, a difference of 0.070%), and Hungarian (48.8%, a difference of 0.070%).
| Demographics | Rating | Rank | Currently Married |
| Immigrants | Hong Kong | 99.5 /100 | #32 | Exceptional 48.9% |
| Irish | 99.5 /100 | #33 | Exceptional 48.9% |
| Immigrants | Lithuania | 99.4 /100 | #34 | Exceptional 48.8% |
| Immigrants | Northern Europe | 99.4 /100 | #35 | Exceptional 48.8% |
| Italians | 99.4 /100 | #36 | Exceptional 48.8% |
| Hungarians | 99.4 /100 | #37 | Exceptional 48.8% |
| Czechoslovakians | 99.4 /100 | #38 | Exceptional 48.8% |
| British | 99.4 /100 | #39 | Exceptional 48.8% |
| Immigrants | Canada | 99.4 /100 | #40 | Exceptional 48.8% |
| Greeks | 99.3 /100 | #41 | Exceptional 48.8% |
| Finns | 99.3 /100 | #42 | Exceptional 48.8% |
| Scotch-Irish | 99.3 /100 | #43 | Exceptional 48.7% |
| Immigrants | North America | 99.3 /100 | #44 | Exceptional 48.7% |
| Belgians | 99.3 /100 | #45 | Exceptional 48.7% |
| Immigrants | Iran | 99.2 /100 | #46 | Exceptional 48.7% |