Sioux vs Immigrants from Lebanon Currently Married

COMPARE

Sioux
Race
Ancestry
AfghanAfricanAlaska NativeAlaskan AthabascanAlbanianAleutAlsatianAmericanApacheArabArapahoArgentineanArmenianAssyrian/Chaldean/SyriacAustralianAustrianBahamianBangladeshiBarbadianBasqueBelgianBelizeanBermudanBhutaneseBlackfeetBolivianBrazilianBritishBritish West IndianBulgarianBurmeseCajunCambodianCanadianCape VerdeanCarpatho RusynCelticCentral AmericanCentral American IndianCherokeeCheyenneChickasawChileanChineseChippewaChoctawColombianColvilleComancheCosta RicanCreeCreekCroatianCrowCubanCypriotCzechCzechoslovakianDanishDelawareDominicanDutchDutch West IndianEastern EuropeanEcuadorianEgyptianEnglishEstonianEthiopianEuropeanFijianFilipinoFinnishFrenchFrench American IndianFrench CanadianGermanGerman RussianGhanaianGreekGuamanian/ChamorroGuatemalanGuyaneseHaitianHmongHonduranHopiHoumaHungarianIcelanderIndian (Asian)IndonesianInupiatIranianIraqiIrishIroquoisIsraeliItalianJamaicanJapaneseJordanianKenyanKiowaKoreanLaotianLatvianLebaneseLiberianLithuanianLumbeeLuxembourgerMacedonianMalaysianMalteseMarshalleseMenomineeMexicanMexican American IndianMongolianMoroccanNative HawaiianNavajoNepaleseNew ZealanderNicaraguanNigerianNorthern EuropeanNorwegianOkinawanOsageOttawaPaiutePakistaniPalestinianPanamanianParaguayanPennsylvania GermanPeruvianPimaPolishPortuguesePotawatomiPuebloPuerto RicanPuget Sound SalishRomanianRussianSalvadoranSamoanScandinavianScotch-IrishScottishSeminoleSenegaleseSerbianShoshoneSierra LeoneanSiouxSlavicSlovakSloveneSomaliSouth AfricanSouth AmericanSouth American IndianSoviet UnionSpaniardSpanishSpanish AmericanSpanish American IndianSri LankanSubsaharan AfricanSudaneseSwedishSwissSyrianTaiwaneseThaiTlingit-HaidaTohono O'OdhamTonganTrinidadian and TobagonianTsimshianTurkishU.S. Virgin IslanderUgandanUkrainianUruguayanUteVenezuelanVietnameseWelshWest IndianYakamaYaquiYugoslavianYumanYup'ikZimbabwean
Immigration
NonimmigrantsImmigrantsAfghanistanAfricaAlbaniaArgentinaArmeniaAsiaAustraliaAustriaBahamasBangladeshBarbadosBelarusBelgiumBelizeBoliviaBosnia and HerzegovinaBrazilBulgariaBurma/MyanmarCabo VerdeCambodiaCameroonCanadaCaribbeanCentral AmericaChileChinaColombiaCongoCosta RicaCroatiaCubaCzechoslovakiaDenmarkDominicaDominican RepublicEastern AfricaEastern AsiaEastern EuropeEcuadorEgyptEl SalvadorEnglandEritreaEthiopiaEuropeFijiFranceGermanyGhanaGreeceGrenadaGuatemalaGuyanaHaitiHondurasHong KongHungaryIndiaIndonesiaIranIraqIrelandIsraelItalyJamaicaJapanJordanKazakhstanKenyaKoreaKuwaitLaosLatin AmericaLatviaLiberiaLithuaniaMalaysiaMexicoMicronesiaMiddle AfricaMoldovaMoroccoNepalNetherlandsNicaraguaNigeriaNorth AmericaNorth MacedoniaNorthern AfricaNorthern EuropeNorwayOceaniaPakistanPanamaPeruPhilippinesPolandPortugalRomaniaRussiaSaudi ArabiaScotlandSenegalSerbiaSierra LeoneSingaporeSomaliaSouth AfricaSouth AmericaSouth Central AsiaSouth Eastern AsiaSouthern EuropeSpainSri LankaSt. Vincent and the GrenadinesSudanSwedenSwitzerlandSyriaTaiwanThailandTrinidad and TobagoTurkeyUgandaUkraineUruguayUzbekistanVenezuelaVietnamWest IndiesWestern AfricaWestern AsiaWestern EuropeYemenZaireZimbabweAzores
Immigrants from Lebanon
Race
Ancestry
AfghanAfricanAlaska NativeAlaskan AthabascanAlbanianAleutAlsatianAmericanApacheArabArapahoArgentineanArmenianAssyrian/Chaldean/SyriacAustralianAustrianBahamianBangladeshiBarbadianBasqueBelgianBelizeanBermudanBhutaneseBlackfeetBolivianBrazilianBritishBritish West IndianBulgarianBurmeseCajunCambodianCanadianCape VerdeanCarpatho RusynCelticCentral AmericanCentral American IndianCherokeeCheyenneChickasawChileanChineseChippewaChoctawColombianColvilleComancheCosta RicanCreeCreekCroatianCrowCubanCypriotCzechCzechoslovakianDanishDelawareDominicanDutchDutch West IndianEastern EuropeanEcuadorianEgyptianEnglishEstonianEthiopianEuropeanFijianFilipinoFinnishFrenchFrench American IndianFrench CanadianGermanGerman RussianGhanaianGreekGuamanian/ChamorroGuatemalanGuyaneseHaitianHmongHonduranHopiHoumaHungarianIcelanderIndian (Asian)IndonesianInupiatIranianIraqiIrishIroquoisIsraeliItalianJamaicanJapaneseJordanianKenyanKiowaKoreanLaotianLatvianLebaneseLiberianLithuanianLumbeeLuxembourgerMacedonianMalaysianMalteseMarshalleseMenomineeMexicanMexican American IndianMongolianMoroccanNative HawaiianNavajoNepaleseNew ZealanderNicaraguanNigerianNorthern EuropeanNorwegianOkinawanOsageOttawaPaiutePakistaniPalestinianPanamanianParaguayanPennsylvania GermanPeruvianPimaPolishPortuguesePotawatomiPuebloPuerto RicanPuget Sound SalishRomanianRussianSalvadoranSamoanScandinavianScotch-IrishScottishSeminoleSenegaleseSerbianShoshoneSierra LeoneanSlavicSlovakSloveneSomaliSouth AfricanSouth AmericanSouth American IndianSoviet UnionSpaniardSpanishSpanish AmericanSpanish American IndianSri LankanSubsaharan AfricanSudaneseSwedishSwissSyrianTaiwaneseThaiTlingit-HaidaTohono O'OdhamTonganTrinidadian and TobagonianTsimshianTurkishU.S. Virgin IslanderUgandanUkrainianUruguayanUteVenezuelanVietnameseWelshWest IndianYakamaYaquiYugoslavianYumanYup'ikZimbabwean
Immigration
NonimmigrantsImmigrantsAfghanistanAfricaAlbaniaArgentinaArmeniaAsiaAustraliaAustriaBahamasBangladeshBarbadosBelarusBelgiumBelizeBoliviaBosnia and HerzegovinaBrazilBulgariaBurma/MyanmarCabo VerdeCambodiaCameroonCanadaCaribbeanCentral AmericaChileChinaColombiaCongoCosta RicaCroatiaCubaCzechoslovakiaDenmarkDominicaDominican RepublicEastern AfricaEastern AsiaEastern EuropeEcuadorEgyptEl SalvadorEnglandEritreaEthiopiaEuropeFijiFranceGermanyGhanaGreeceGrenadaGuatemalaGuyanaHaitiHondurasHong KongHungaryIndiaIndonesiaIranIraqIrelandIsraelItalyJamaicaJapanJordanKazakhstanKenyaKoreaKuwaitLaosLatin AmericaLatviaLebanonLiberiaLithuaniaMalaysiaMexicoMicronesiaMiddle AfricaMoldovaMoroccoNepalNetherlandsNicaraguaNigeriaNorth AmericaNorth MacedoniaNorthern AfricaNorthern EuropeNorwayOceaniaPakistanPanamaPeruPhilippinesPolandPortugalRomaniaRussiaSaudi ArabiaScotlandSenegalSerbiaSierra LeoneSingaporeSomaliaSouth AfricaSouth AmericaSouth Central AsiaSouth Eastern AsiaSouthern EuropeSpainSri LankaSt. Vincent and the GrenadinesSudanSwedenSwitzerlandSyriaTaiwanThailandTrinidad and TobagoTurkeyUgandaUkraineUruguayUzbekistanVenezuelaVietnamWest IndiesWestern AfricaWestern AsiaWestern EuropeYemenZaireZimbabweAzores
Currently Married
Income
Poverty
Unemployment
Labor Participation
Family Structure
Vehicle Availability
Education Level
Disability

Currently Married Comparison

Sioux

Immigrants from Lebanon

Tragic
Exceptional
41.9%
CURRENTLY MARRIED
0.0/ 100
METRIC RATING
303rd/ 347
METRIC RANK
48.2%
CURRENTLY MARRIED
97.6/ 100
METRIC RATING
72nd/ 347
METRIC RANK

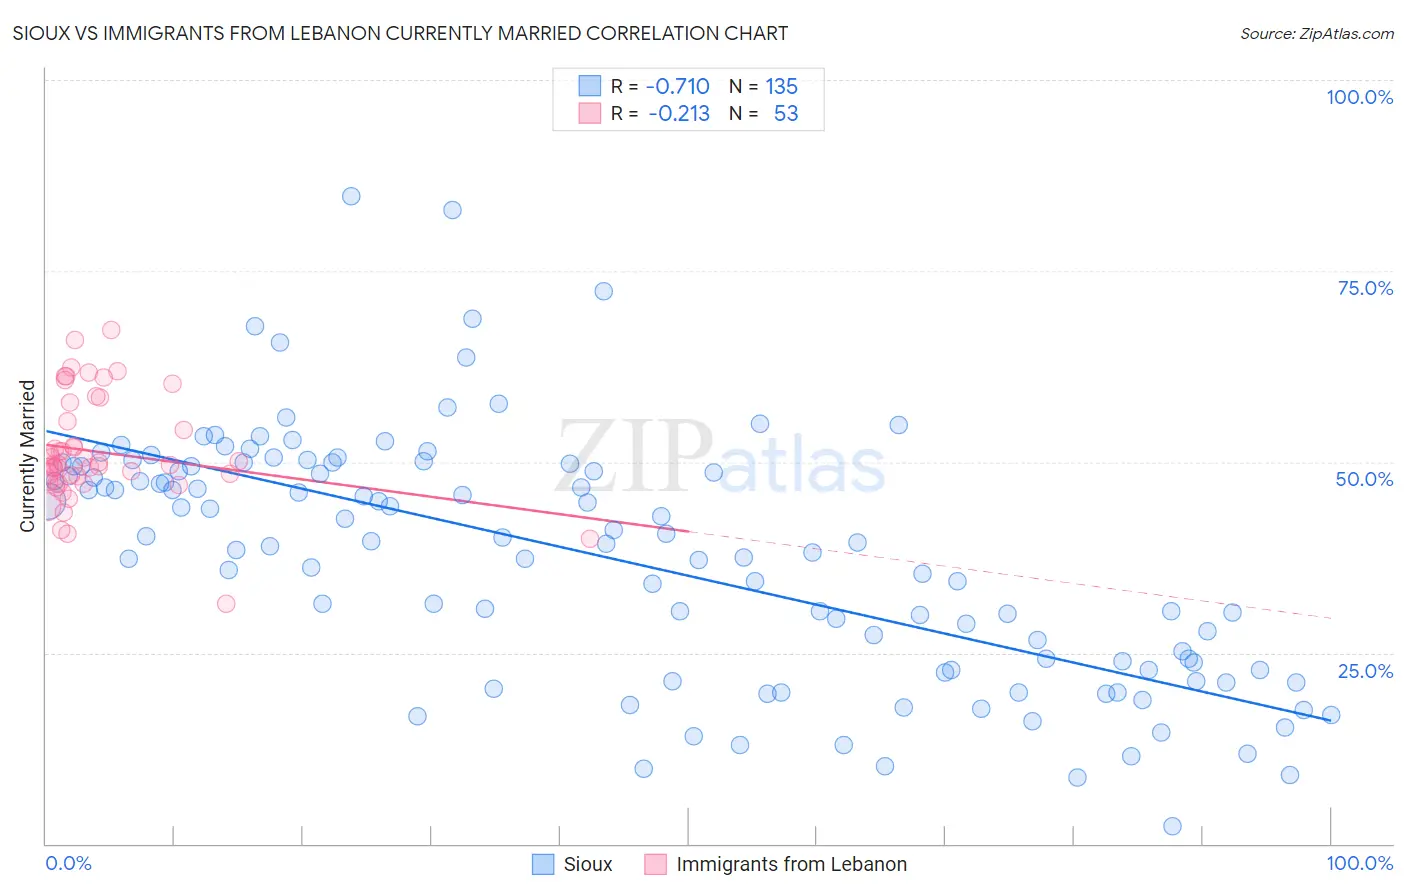
Sioux vs Immigrants from Lebanon Currently Married Correlation Chart

The statistical analysis conducted on geographies consisting of 234,188,920 people shows a strong negative correlation between the proportion of Sioux and percentage of population currently married in the United States with a correlation coefficient (R) of -0.710 and weighted average of 41.9%. Similarly, the statistical analysis conducted on geographies consisting of 217,155,711 people shows a weak negative correlation between the proportion of Immigrants from Lebanon and percentage of population currently married in the United States with a correlation coefficient (R) of -0.213 and weighted average of 48.2%, a difference of 14.9%.
Sioux vs Immigrants from Lebanon Currently Married

Currently Married Correlation Summary

MeasurementSiouxImmigrants from Lebanon
Minimum2.3%31.4%
Maximum84.8%67.2%
Range82.5%35.8%
Mean37.5%51.3%
Median39.4%49.7%
Interquartile 25% (IQ1)22.8%47.4%
Interquartile 75% (IQ3)49.5%56.5%
Interquartile Range (IQR)26.7%9.2%
Standard Deviation (Sample)16.0%7.0%
Standard Deviation (Population)16.0%6.9%

Similar Demographics by Currently Married

Demographics Similar to Sioux by Currently Married

In terms of currently married, the demographic groups most similar to Sioux are Immigrants from Zaire (42.0%, a difference of 0.010%), Immigrants from Bahamas (41.9%, a difference of 0.11%), Immigrants from Trinidad and Tobago (41.9%, a difference of 0.15%), Immigrants from Guyana (41.9%, a difference of 0.16%), and Immigrants from Yemen (42.1%, a difference of 0.26%).
DemographicsRating | RankCurrently Married
Menominee
0.0
/100
|
#296
Tragic
42.3%
Cheyenne
0.0
/100
|
#297
Tragic
42.2%
Immigrants | Honduras
0.0
/100
|
#298
Tragic
42.2%
Liberians
0.0
/100
|
#299
Tragic
42.2%
Belizeans
0.0
/100
|
#300
Tragic
42.2%
Immigrants | Yemen
0.0
/100
|
#301
Tragic
42.1%
Immigrants | Zaire
0.0
/100
|
#302
Tragic
42.0%
Sioux
0.0
/100
|
#303
Tragic
41.9%
Immigrants | Bahamas
0.0
/100
|
#304
Tragic
41.9%
Immigrants | Trinidad and Tobago
0.0
/100
|
#305
Tragic
41.9%
Immigrants | Guyana
0.0
/100
|
#306
Tragic
41.9%
Africans
0.0
/100
|
#307
Tragic
41.8%
Immigrants | Belize
0.0
/100
|
#308
Tragic
41.8%
Immigrants | Liberia
0.0
/100
|
#309
Tragic
41.8%
Guyanese
0.0
/100
|
#310
Tragic
41.6%

Demographics Similar to Immigrants from Lebanon by Currently Married

In terms of currently married, the demographic groups most similar to Immigrants from Lebanon are Immigrants from Eastern Asia (48.2%, a difference of 0.020%), Estonian (48.2%, a difference of 0.050%), Immigrants from Belarus (48.1%, a difference of 0.12%), Macedonian (48.3%, a difference of 0.14%), and Basque (48.1%, a difference of 0.14%).
DemographicsRating | RankCurrently Married
Ukrainians
98.3
/100
|
#65
Exceptional
48.4%
Tongans
98.2
/100
|
#66
Exceptional
48.3%
Slovaks
98.2
/100
|
#67
Exceptional
48.3%
Immigrants | England
98.2
/100
|
#68
Exceptional
48.3%
Canadians
98.1
/100
|
#69
Exceptional
48.3%
Immigrants | Asia
97.9
/100
|
#70
Exceptional
48.3%
Macedonians
97.9
/100
|
#71
Exceptional
48.3%
Immigrants | Lebanon
97.6
/100
|
#72
Exceptional
48.2%
Immigrants | Eastern Asia
97.5
/100
|
#73
Exceptional
48.2%
Estonians
97.4
/100
|
#74
Exceptional
48.2%
Immigrants | Belarus
97.2
/100
|
#75
Exceptional
48.1%
Basques
97.2
/100
|
#76
Exceptional
48.1%
Slovenes
97.1
/100
|
#77
Exceptional
48.1%
Immigrants | Belgium
97.1
/100
|
#78
Exceptional
48.1%
Immigrants | South Africa
97.0
/100
|
#79
Exceptional
48.1%