Immigrants from Singapore vs British Currently Married
COMPARE
Immigrants from Singapore
British
Currently Married
Currently Married Comparison
Immigrants from Singapore
British
47.8%
CURRENTLY MARRIED
93.3/ 100
METRIC RATING
105th/ 347
METRIC RANK
48.8%
CURRENTLY MARRIED
99.4/ 100
METRIC RATING
39th/ 347
METRIC RANK
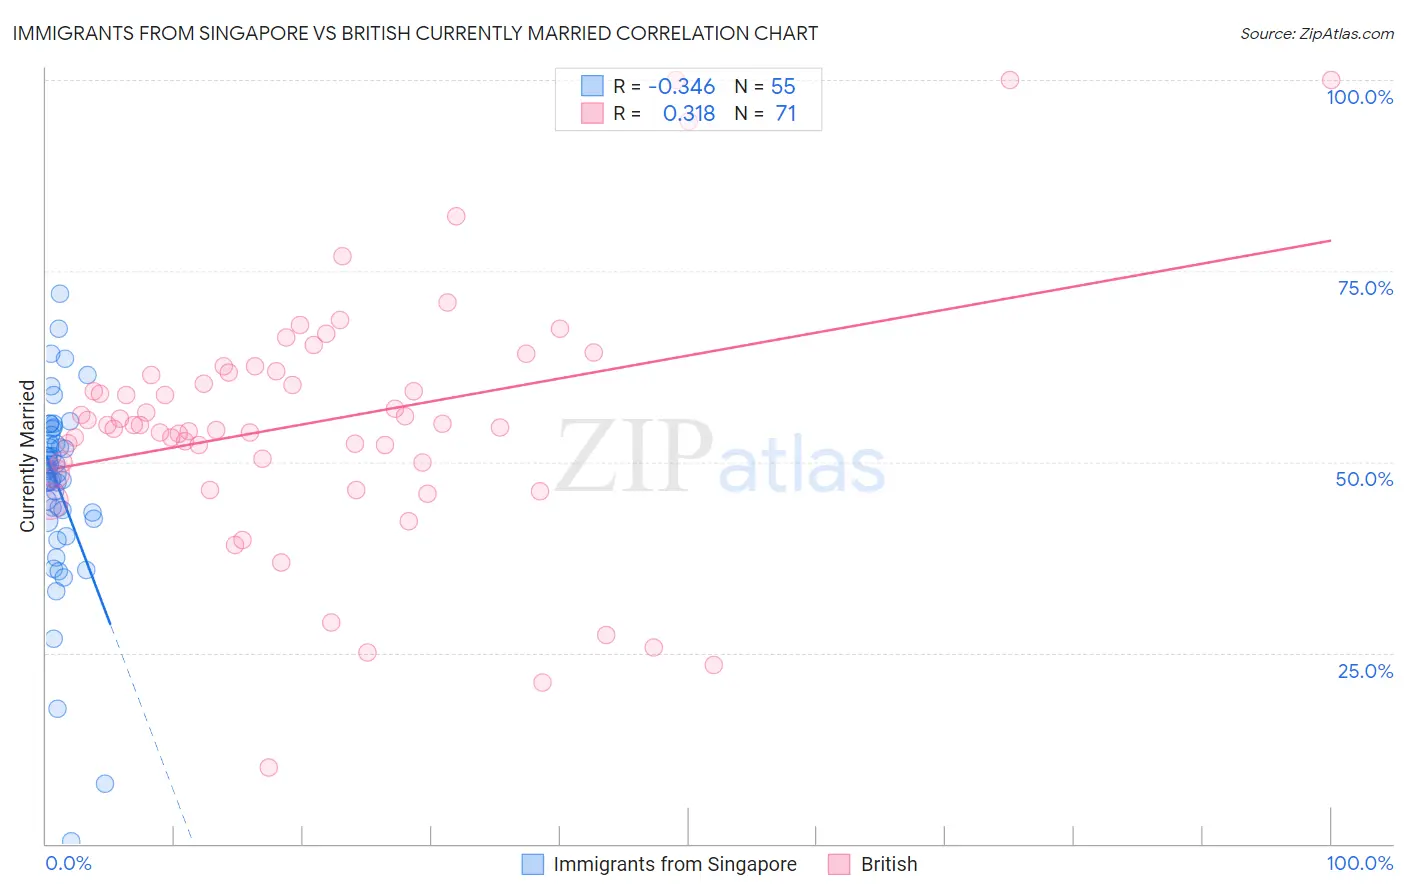
Immigrants from Singapore vs British Currently Married Correlation Chart
The statistical analysis conducted on geographies consisting of 137,494,122 people shows a mild negative correlation between the proportion of Immigrants from Singapore and percentage of population currently married in the United States with a correlation coefficient (R) of -0.346 and weighted average of 47.8%. Similarly, the statistical analysis conducted on geographies consisting of 531,372,263 people shows a mild positive correlation between the proportion of British and percentage of population currently married in the United States with a correlation coefficient (R) of 0.318 and weighted average of 48.8%, a difference of 2.2%.
Currently Married Correlation Summary
| Measurement | Immigrants from Singapore | British |
| Minimum | 0.40% | 10.0% |
| Maximum | 72.0% | 100.0% |
| Range | 71.6% | 90.0% |
| Mean | 46.7% | 55.4% |
| Median | 48.4% | 54.9% |
| Interquartile 25% (IQ1) | 42.6% | 50.0% |
| Interquartile 75% (IQ3) | 53.5% | 61.8% |
| Interquartile Range (IQR) | 10.9% | 11.8% |
| Standard Deviation (Sample) | 12.7% | 16.7% |
| Standard Deviation (Population) | 12.6% | 16.6% |
Similar Demographics by Currently Married
Demographics Similar to Immigrants from Singapore by Currently Married
In terms of currently married, the demographic groups most similar to Immigrants from Singapore are Immigrants from Greece (47.7%, a difference of 0.030%), Serbian (47.8%, a difference of 0.050%), Immigrants from Italy (47.7%, a difference of 0.060%), Cypriot (47.8%, a difference of 0.070%), and Turkish (47.8%, a difference of 0.090%).
| Demographics | Rating | Rank | Currently Married |
| Immigrants | China | 94.7 /100 | #98 | Exceptional 47.9% |
| Immigrants | Sweden | 94.3 /100 | #99 | Exceptional 47.8% |
| Celtics | 94.2 /100 | #100 | Exceptional 47.8% |
| Immigrants | Germany | 94.1 /100 | #101 | Exceptional 47.8% |
| Turks | 93.9 /100 | #102 | Exceptional 47.8% |
| Cypriots | 93.7 /100 | #103 | Exceptional 47.8% |
| Serbians | 93.6 /100 | #104 | Exceptional 47.8% |
| Immigrants | Singapore | 93.3 /100 | #105 | Exceptional 47.8% |
| Immigrants | Greece | 93.1 /100 | #106 | Exceptional 47.7% |
| Immigrants | Italy | 92.9 /100 | #107 | Exceptional 47.7% |
| Tsimshian | 92.4 /100 | #108 | Exceptional 47.7% |
| Immigrants | Egypt | 92.3 /100 | #109 | Exceptional 47.7% |
| Immigrants | Russia | 92.0 /100 | #110 | Exceptional 47.7% |
| Immigrants | Hungary | 91.2 /100 | #111 | Exceptional 47.6% |
| Immigrants | Western Europe | 91.1 /100 | #112 | Exceptional 47.6% |
Demographics Similar to British by Currently Married
In terms of currently married, the demographic groups most similar to British are Immigrants from Canada (48.8%, a difference of 0.020%), Czechoslovakian (48.8%, a difference of 0.030%), Greek (48.8%, a difference of 0.040%), Italian (48.8%, a difference of 0.070%), and Hungarian (48.8%, a difference of 0.070%).
| Demographics | Rating | Rank | Currently Married |
| Immigrants | Hong Kong | 99.5 /100 | #32 | Exceptional 48.9% |
| Irish | 99.5 /100 | #33 | Exceptional 48.9% |
| Immigrants | Lithuania | 99.4 /100 | #34 | Exceptional 48.8% |
| Immigrants | Northern Europe | 99.4 /100 | #35 | Exceptional 48.8% |
| Italians | 99.4 /100 | #36 | Exceptional 48.8% |
| Hungarians | 99.4 /100 | #37 | Exceptional 48.8% |
| Czechoslovakians | 99.4 /100 | #38 | Exceptional 48.8% |
| British | 99.4 /100 | #39 | Exceptional 48.8% |
| Immigrants | Canada | 99.4 /100 | #40 | Exceptional 48.8% |
| Greeks | 99.3 /100 | #41 | Exceptional 48.8% |
| Finns | 99.3 /100 | #42 | Exceptional 48.8% |
| Scotch-Irish | 99.3 /100 | #43 | Exceptional 48.7% |
| Immigrants | North America | 99.3 /100 | #44 | Exceptional 48.7% |
| Belgians | 99.3 /100 | #45 | Exceptional 48.7% |
| Immigrants | Iran | 99.2 /100 | #46 | Exceptional 48.7% |