Immigrants from Guatemala vs British Currently Married
COMPARE
Immigrants from Guatemala
British
Currently Married
Currently Married Comparison
Immigrants from Guatemala
British
42.6%
CURRENTLY MARRIED
0.0/ 100
METRIC RATING
291st/ 347
METRIC RANK
48.8%
CURRENTLY MARRIED
99.4/ 100
METRIC RATING
39th/ 347
METRIC RANK
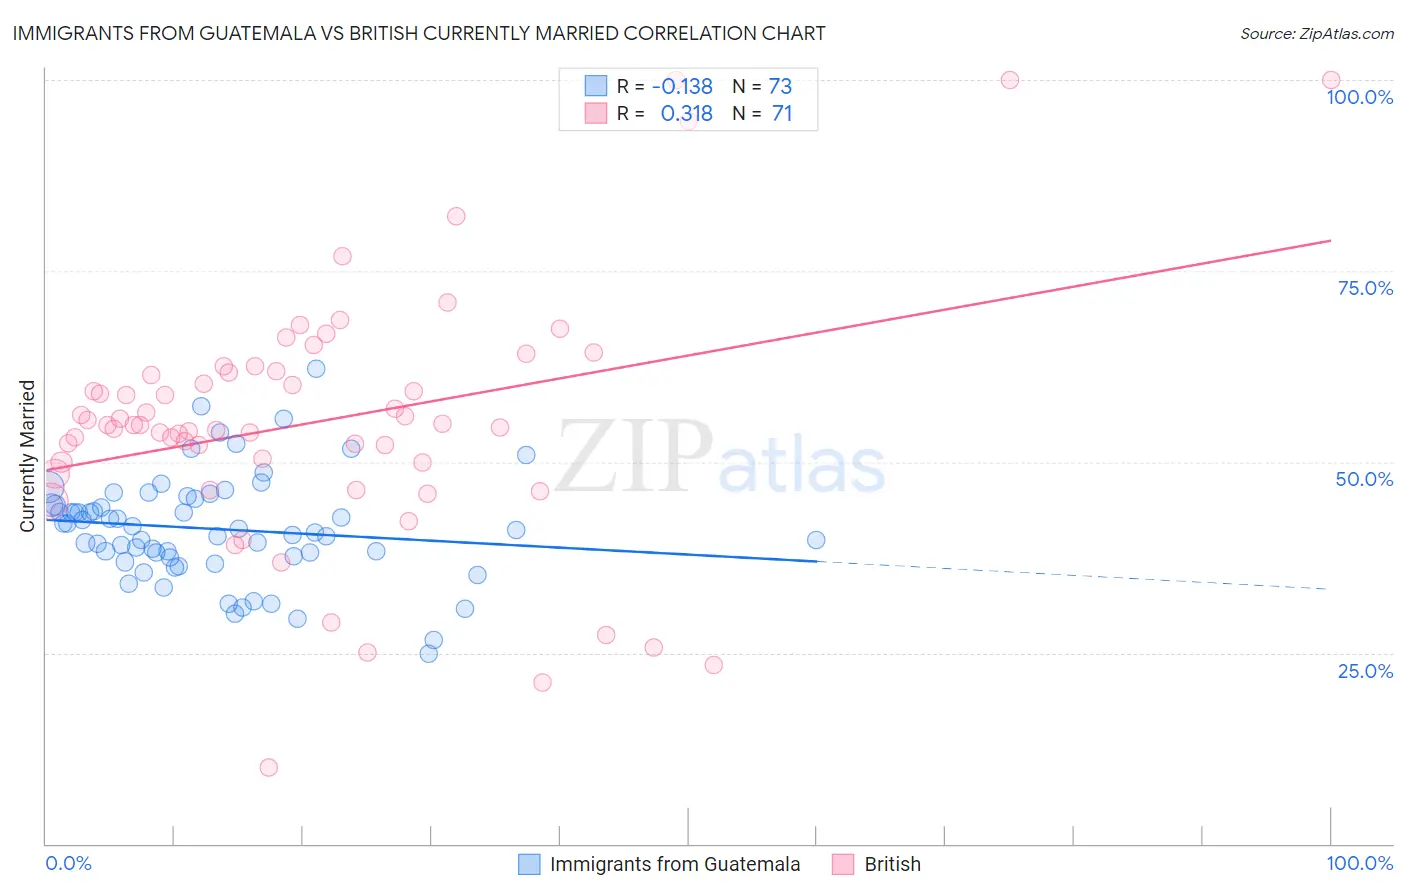
Immigrants from Guatemala vs British Currently Married Correlation Chart
The statistical analysis conducted on geographies consisting of 377,254,434 people shows a poor negative correlation between the proportion of Immigrants from Guatemala and percentage of population currently married in the United States with a correlation coefficient (R) of -0.138 and weighted average of 42.6%. Similarly, the statistical analysis conducted on geographies consisting of 531,372,263 people shows a mild positive correlation between the proportion of British and percentage of population currently married in the United States with a correlation coefficient (R) of 0.318 and weighted average of 48.8%, a difference of 14.4%.
Currently Married Correlation Summary
| Measurement | Immigrants from Guatemala | British |
| Minimum | 24.9% | 10.0% |
| Maximum | 62.2% | 100.0% |
| Range | 37.3% | 90.0% |
| Mean | 41.2% | 55.4% |
| Median | 41.0% | 54.9% |
| Interquartile 25% (IQ1) | 37.6% | 50.0% |
| Interquartile 75% (IQ3) | 44.7% | 61.8% |
| Interquartile Range (IQR) | 7.1% | 11.8% |
| Standard Deviation (Sample) | 6.9% | 16.7% |
| Standard Deviation (Population) | 6.9% | 16.6% |
Similar Demographics by Currently Married
Demographics Similar to Immigrants from Guatemala by Currently Married
In terms of currently married, the demographic groups most similar to Immigrants from Guatemala are Paiute (42.7%, a difference of 0.12%), Immigrants from Ghana (42.7%, a difference of 0.12%), Subsaharan African (42.6%, a difference of 0.16%), Yuman (42.6%, a difference of 0.18%), and Honduran (42.5%, a difference of 0.30%).
| Demographics | Rating | Rank | Currently Married |
| Immigrants | El Salvador | 0.0 /100 | #284 | Tragic 43.1% |
| Immigrants | Middle Africa | 0.0 /100 | #285 | Tragic 43.0% |
| Ghanaians | 0.0 /100 | #286 | Tragic 42.9% |
| Guatemalans | 0.0 /100 | #287 | Tragic 42.9% |
| Natives/Alaskans | 0.0 /100 | #288 | Tragic 42.8% |
| Paiute | 0.0 /100 | #289 | Tragic 42.7% |
| Immigrants | Ghana | 0.0 /100 | #290 | Tragic 42.7% |
| Immigrants | Guatemala | 0.0 /100 | #291 | Tragic 42.6% |
| Sub-Saharan Africans | 0.0 /100 | #292 | Tragic 42.6% |
| Yuman | 0.0 /100 | #293 | Tragic 42.6% |
| Hondurans | 0.0 /100 | #294 | Tragic 42.5% |
| Immigrants | Western Africa | 0.0 /100 | #295 | Tragic 42.4% |
| Menominee | 0.0 /100 | #296 | Tragic 42.3% |
| Cheyenne | 0.0 /100 | #297 | Tragic 42.2% |
| Immigrants | Honduras | 0.0 /100 | #298 | Tragic 42.2% |
Demographics Similar to British by Currently Married
In terms of currently married, the demographic groups most similar to British are Immigrants from Canada (48.8%, a difference of 0.020%), Czechoslovakian (48.8%, a difference of 0.030%), Greek (48.8%, a difference of 0.040%), Italian (48.8%, a difference of 0.070%), and Hungarian (48.8%, a difference of 0.070%).
| Demographics | Rating | Rank | Currently Married |
| Immigrants | Hong Kong | 99.5 /100 | #32 | Exceptional 48.9% |
| Irish | 99.5 /100 | #33 | Exceptional 48.9% |
| Immigrants | Lithuania | 99.4 /100 | #34 | Exceptional 48.8% |
| Immigrants | Northern Europe | 99.4 /100 | #35 | Exceptional 48.8% |
| Italians | 99.4 /100 | #36 | Exceptional 48.8% |
| Hungarians | 99.4 /100 | #37 | Exceptional 48.8% |
| Czechoslovakians | 99.4 /100 | #38 | Exceptional 48.8% |
| British | 99.4 /100 | #39 | Exceptional 48.8% |
| Immigrants | Canada | 99.4 /100 | #40 | Exceptional 48.8% |
| Greeks | 99.3 /100 | #41 | Exceptional 48.8% |
| Finns | 99.3 /100 | #42 | Exceptional 48.8% |
| Scotch-Irish | 99.3 /100 | #43 | Exceptional 48.7% |
| Immigrants | North America | 99.3 /100 | #44 | Exceptional 48.7% |
| Belgians | 99.3 /100 | #45 | Exceptional 48.7% |
| Immigrants | Iran | 99.2 /100 | #46 | Exceptional 48.7% |