Sioux vs Immigrants from Turkey Currently Married
COMPARE
Sioux
Immigrants from Turkey
Currently Married
Currently Married Comparison
Sioux
Immigrants from Turkey
41.9%
CURRENTLY MARRIED
0.0/ 100
METRIC RATING
303rd/ 347
METRIC RANK
47.0%
CURRENTLY MARRIED
70.0/ 100
METRIC RATING
150th/ 347
METRIC RANK
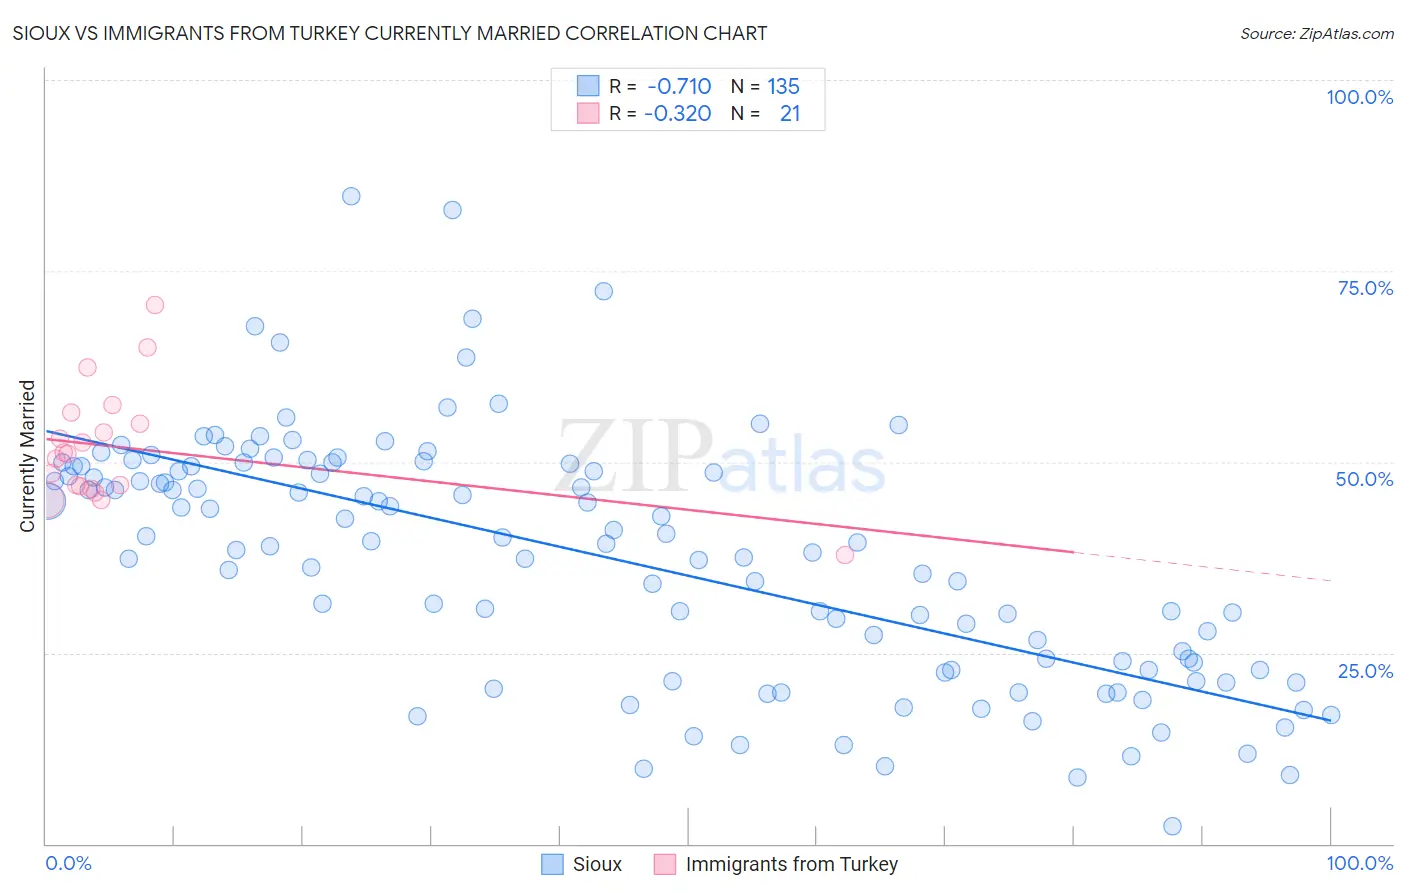
Sioux vs Immigrants from Turkey Currently Married Correlation Chart
The statistical analysis conducted on geographies consisting of 234,188,920 people shows a strong negative correlation between the proportion of Sioux and percentage of population currently married in the United States with a correlation coefficient (R) of -0.710 and weighted average of 41.9%. Similarly, the statistical analysis conducted on geographies consisting of 223,037,239 people shows a mild negative correlation between the proportion of Immigrants from Turkey and percentage of population currently married in the United States with a correlation coefficient (R) of -0.320 and weighted average of 47.0%, a difference of 12.0%.
Currently Married Correlation Summary
| Measurement | Sioux | Immigrants from Turkey |
| Minimum | 2.3% | 37.8% |
| Maximum | 84.8% | 70.5% |
| Range | 82.5% | 32.7% |
| Mean | 37.5% | 51.8% |
| Median | 39.4% | 51.0% |
| Interquartile 25% (IQ1) | 22.8% | 46.7% |
| Interquartile 75% (IQ3) | 49.5% | 55.7% |
| Interquartile Range (IQR) | 26.7% | 9.0% |
| Standard Deviation (Sample) | 16.0% | 7.6% |
| Standard Deviation (Population) | 16.0% | 7.4% |
Similar Demographics by Currently Married
Demographics Similar to Sioux by Currently Married
In terms of currently married, the demographic groups most similar to Sioux are Immigrants from Zaire (42.0%, a difference of 0.010%), Immigrants from Bahamas (41.9%, a difference of 0.11%), Immigrants from Trinidad and Tobago (41.9%, a difference of 0.15%), Immigrants from Guyana (41.9%, a difference of 0.16%), and Immigrants from Yemen (42.1%, a difference of 0.26%).
| Demographics | Rating | Rank | Currently Married |
| Menominee | 0.0 /100 | #296 | Tragic 42.3% |
| Cheyenne | 0.0 /100 | #297 | Tragic 42.2% |
| Immigrants | Honduras | 0.0 /100 | #298 | Tragic 42.2% |
| Liberians | 0.0 /100 | #299 | Tragic 42.2% |
| Belizeans | 0.0 /100 | #300 | Tragic 42.2% |
| Immigrants | Yemen | 0.0 /100 | #301 | Tragic 42.1% |
| Immigrants | Zaire | 0.0 /100 | #302 | Tragic 42.0% |
| Sioux | 0.0 /100 | #303 | Tragic 41.9% |
| Immigrants | Bahamas | 0.0 /100 | #304 | Tragic 41.9% |
| Immigrants | Trinidad and Tobago | 0.0 /100 | #305 | Tragic 41.9% |
| Immigrants | Guyana | 0.0 /100 | #306 | Tragic 41.9% |
| Africans | 0.0 /100 | #307 | Tragic 41.8% |
| Immigrants | Belize | 0.0 /100 | #308 | Tragic 41.8% |
| Immigrants | Liberia | 0.0 /100 | #309 | Tragic 41.8% |
| Guyanese | 0.0 /100 | #310 | Tragic 41.6% |
Demographics Similar to Immigrants from Turkey by Currently Married
In terms of currently married, the demographic groups most similar to Immigrants from Turkey are Zimbabwean (47.0%, a difference of 0.0%), Cambodian (47.0%, a difference of 0.010%), Chilean (47.0%, a difference of 0.010%), Immigrants from Serbia (47.0%, a difference of 0.050%), and Immigrants from Venezuela (47.0%, a difference of 0.060%).
| Demographics | Rating | Rank | Currently Married |
| Guamanians/Chamorros | 74.2 /100 | #143 | Good 47.1% |
| Hmong | 73.4 /100 | #144 | Good 47.1% |
| Immigrants | South Eastern Asia | 72.9 /100 | #145 | Good 47.1% |
| Carpatho Rusyns | 72.6 /100 | #146 | Good 47.0% |
| Immigrants | Argentina | 72.0 /100 | #147 | Good 47.0% |
| Cambodians | 70.4 /100 | #148 | Good 47.0% |
| Zimbabweans | 70.1 /100 | #149 | Good 47.0% |
| Immigrants | Turkey | 70.0 /100 | #150 | Good 47.0% |
| Chileans | 69.8 /100 | #151 | Good 47.0% |
| Immigrants | Serbia | 68.8 /100 | #152 | Good 47.0% |
| Immigrants | Venezuela | 68.6 /100 | #153 | Good 47.0% |
| Albanians | 68.6 /100 | #154 | Good 47.0% |
| Arabs | 68.6 /100 | #155 | Good 47.0% |
| Spanish | 68.1 /100 | #156 | Good 47.0% |
| Immigrants | Switzerland | 67.8 /100 | #157 | Good 46.9% |