Sierra Leonean vs Nicaraguan Family Households
COMPARE
Sierra Leonean
Nicaraguan
Family Households
Family Households Comparison
Sierra Leoneans
Nicaraguans
63.9%
FAMILY HOUSEHOLDS
11.2/ 100
METRIC RATING
209th/ 347
METRIC RANK
67.4%
FAMILY HOUSEHOLDS
100.0/ 100
METRIC RATING
29th/ 347
METRIC RANK
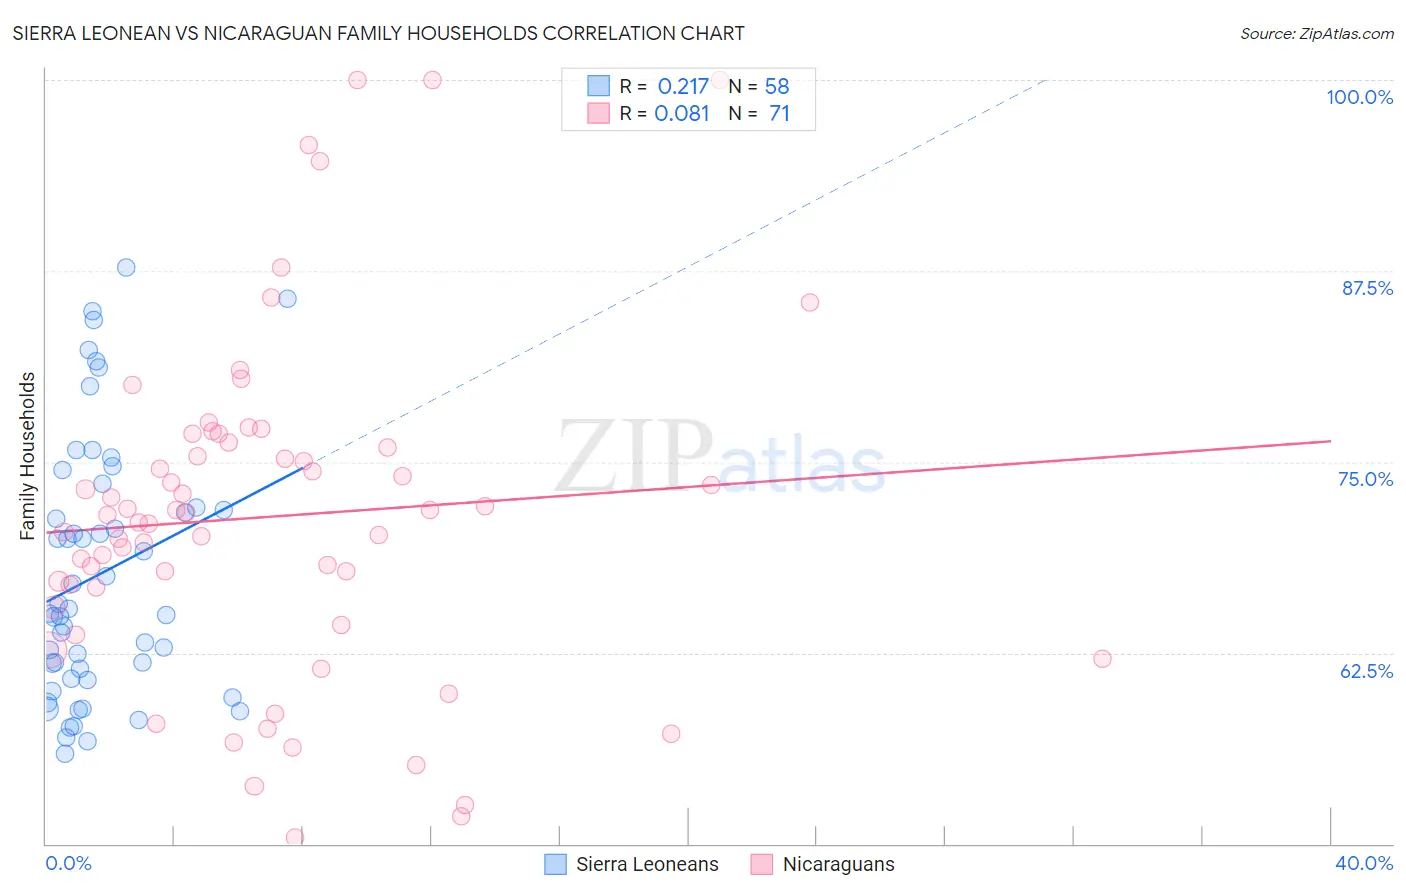
Sierra Leonean vs Nicaraguan Family Households Correlation Chart
The statistical analysis conducted on geographies consisting of 83,352,562 people shows a weak positive correlation between the proportion of Sierra Leoneans and percentage of family households in the United States with a correlation coefficient (R) of 0.217 and weighted average of 63.9%. Similarly, the statistical analysis conducted on geographies consisting of 285,625,723 people shows a slight positive correlation between the proportion of Nicaraguans and percentage of family households in the United States with a correlation coefficient (R) of 0.081 and weighted average of 67.4%, a difference of 5.5%.
Family Households Correlation Summary
| Measurement | Sierra Leonean | Nicaraguan |
| Minimum | 55.9% | 50.4% |
| Maximum | 87.8% | 100.0% |
| Range | 31.8% | 49.6% |
| Mean | 67.7% | 71.4% |
| Median | 65.2% | 71.5% |
| Interquartile 25% (IQ1) | 60.8% | 65.5% |
| Interquartile 75% (IQ3) | 72.0% | 76.3% |
| Interquartile Range (IQR) | 11.2% | 10.8% |
| Standard Deviation (Sample) | 8.4% | 11.0% |
| Standard Deviation (Population) | 8.4% | 10.9% |
Similar Demographics by Family Households
Demographics Similar to Sierra Leoneans by Family Households
In terms of family households, the demographic groups most similar to Sierra Leoneans are Nigerian (63.9%, a difference of 0.010%), Immigrants from Bangladesh (63.9%, a difference of 0.010%), Immigrants from Lithuania (63.9%, a difference of 0.030%), Brazilian (63.9%, a difference of 0.040%), and Immigrants from Uruguay (63.9%, a difference of 0.050%).
| Demographics | Rating | Rank | Family Households |
| Iranians | 13.5 /100 | #202 | Poor 63.9% |
| Norwegians | 13.2 /100 | #203 | Poor 63.9% |
| Immigrants | Uruguay | 12.8 /100 | #204 | Poor 63.9% |
| Brazilians | 12.4 /100 | #205 | Poor 63.9% |
| Immigrants | Lithuania | 12.1 /100 | #206 | Poor 63.9% |
| Nigerians | 11.5 /100 | #207 | Poor 63.9% |
| Immigrants | Bangladesh | 11.4 /100 | #208 | Poor 63.9% |
| Sierra Leoneans | 11.2 /100 | #209 | Poor 63.9% |
| Immigrants | Thailand | 9.6 /100 | #210 | Tragic 63.8% |
| Shoshone | 9.4 /100 | #211 | Tragic 63.8% |
| Immigrants | Netherlands | 9.4 /100 | #212 | Tragic 63.8% |
| Immigrants | Northern Europe | 8.8 /100 | #213 | Tragic 63.8% |
| Celtics | 8.0 /100 | #214 | Tragic 63.8% |
| Belgians | 7.6 /100 | #215 | Tragic 63.8% |
| Croatians | 7.3 /100 | #216 | Tragic 63.8% |
Demographics Similar to Nicaraguans by Family Households
In terms of family households, the demographic groups most similar to Nicaraguans are Hawaiian (67.4%, a difference of 0.070%), Hispanic or Latino (67.4%, a difference of 0.080%), Immigrants from India (67.4%, a difference of 0.13%), Immigrants from Nicaragua (67.5%, a difference of 0.14%), and Immigrants from South Eastern Asia (67.5%, a difference of 0.16%).
| Demographics | Rating | Rank | Family Households |
| Sri Lankans | 100.0 /100 | #22 | Exceptional 67.7% |
| Immigrants | Pakistan | 100.0 /100 | #23 | Exceptional 67.7% |
| Immigrants | South Eastern Asia | 100.0 /100 | #24 | Exceptional 67.5% |
| Immigrants | Nicaragua | 100.0 /100 | #25 | Exceptional 67.5% |
| Immigrants | India | 100.0 /100 | #26 | Exceptional 67.4% |
| Hispanics or Latinos | 100.0 /100 | #27 | Exceptional 67.4% |
| Hawaiians | 100.0 /100 | #28 | Exceptional 67.4% |
| Nicaraguans | 100.0 /100 | #29 | Exceptional 67.4% |
| Immigrants | Peru | 100.0 /100 | #30 | Exceptional 67.2% |
| Immigrants | Latin America | 100.0 /100 | #31 | Exceptional 67.2% |
| Nepalese | 100.0 /100 | #32 | Exceptional 67.2% |
| Salvadorans | 100.0 /100 | #33 | Exceptional 67.2% |
| Thais | 100.0 /100 | #34 | Exceptional 67.2% |
| Tohono O'odham | 100.0 /100 | #35 | Exceptional 67.1% |
| Peruvians | 100.0 /100 | #36 | Exceptional 67.1% |