Sierra Leonean vs Immigrants from Czechoslovakia Family Households
COMPARE
Sierra Leonean
Immigrants from Czechoslovakia
Family Households
Family Households Comparison
Sierra Leoneans
Immigrants from Czechoslovakia
63.9%
FAMILY HOUSEHOLDS
11.2/ 100
METRIC RATING
209th/ 347
METRIC RANK
63.4%
FAMILY HOUSEHOLDS
1.8/ 100
METRIC RATING
243rd/ 347
METRIC RANK
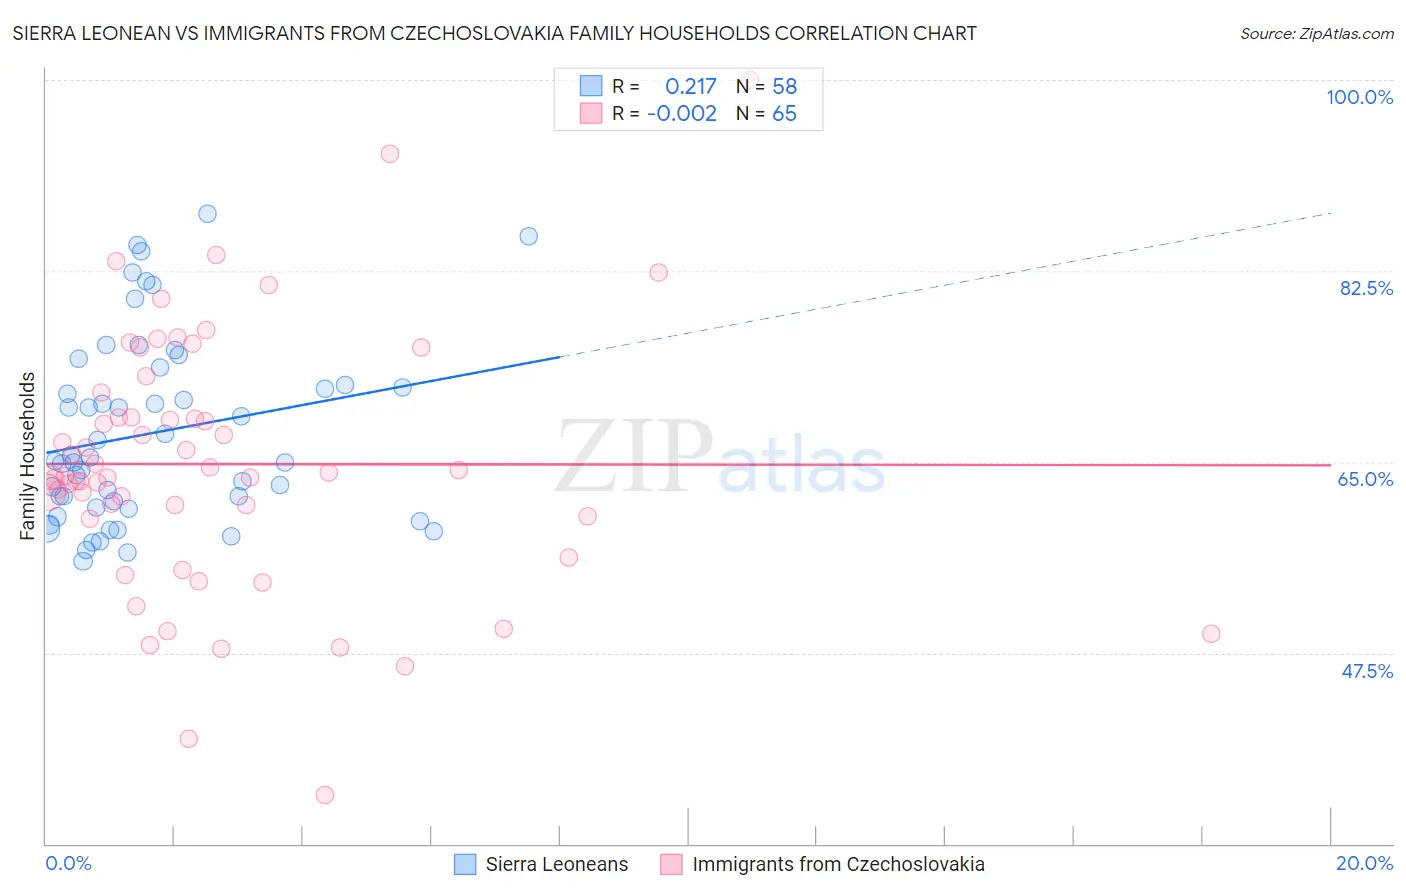
Sierra Leonean vs Immigrants from Czechoslovakia Family Households Correlation Chart
The statistical analysis conducted on geographies consisting of 83,352,562 people shows a weak positive correlation between the proportion of Sierra Leoneans and percentage of family households in the United States with a correlation coefficient (R) of 0.217 and weighted average of 63.9%. Similarly, the statistical analysis conducted on geographies consisting of 195,445,494 people shows no correlation between the proportion of Immigrants from Czechoslovakia and percentage of family households in the United States with a correlation coefficient (R) of -0.002 and weighted average of 63.4%, a difference of 0.67%.
Family Households Correlation Summary
| Measurement | Sierra Leonean | Immigrants from Czechoslovakia |
| Minimum | 55.9% | 34.4% |
| Maximum | 87.8% | 100.0% |
| Range | 31.8% | 65.6% |
| Mean | 67.7% | 64.8% |
| Median | 65.2% | 63.7% |
| Interquartile 25% (IQ1) | 60.8% | 59.9% |
| Interquartile 75% (IQ3) | 72.0% | 70.2% |
| Interquartile Range (IQR) | 11.2% | 10.4% |
| Standard Deviation (Sample) | 8.4% | 11.8% |
| Standard Deviation (Population) | 8.4% | 11.7% |
Similar Demographics by Family Households
Demographics Similar to Sierra Leoneans by Family Households
In terms of family households, the demographic groups most similar to Sierra Leoneans are Nigerian (63.9%, a difference of 0.010%), Immigrants from Bangladesh (63.9%, a difference of 0.010%), Immigrants from Lithuania (63.9%, a difference of 0.030%), Brazilian (63.9%, a difference of 0.040%), and Immigrants from Uruguay (63.9%, a difference of 0.050%).
| Demographics | Rating | Rank | Family Households |
| Iranians | 13.5 /100 | #202 | Poor 63.9% |
| Norwegians | 13.2 /100 | #203 | Poor 63.9% |
| Immigrants | Uruguay | 12.8 /100 | #204 | Poor 63.9% |
| Brazilians | 12.4 /100 | #205 | Poor 63.9% |
| Immigrants | Lithuania | 12.1 /100 | #206 | Poor 63.9% |
| Nigerians | 11.5 /100 | #207 | Poor 63.9% |
| Immigrants | Bangladesh | 11.4 /100 | #208 | Poor 63.9% |
| Sierra Leoneans | 11.2 /100 | #209 | Poor 63.9% |
| Immigrants | Thailand | 9.6 /100 | #210 | Tragic 63.8% |
| Shoshone | 9.4 /100 | #211 | Tragic 63.8% |
| Immigrants | Netherlands | 9.4 /100 | #212 | Tragic 63.8% |
| Immigrants | Northern Europe | 8.8 /100 | #213 | Tragic 63.8% |
| Celtics | 8.0 /100 | #214 | Tragic 63.8% |
| Belgians | 7.6 /100 | #215 | Tragic 63.8% |
| Croatians | 7.3 /100 | #216 | Tragic 63.8% |
Demographics Similar to Immigrants from Czechoslovakia by Family Households
In terms of family households, the demographic groups most similar to Immigrants from Czechoslovakia are Immigrants from Israel (63.4%, a difference of 0.010%), Immigrants from St. Vincent and the Grenadines (63.4%, a difference of 0.020%), Aleut (63.4%, a difference of 0.030%), South African (63.4%, a difference of 0.030%), and Eastern European (63.4%, a difference of 0.030%).
| Demographics | Rating | Rank | Family Households |
| Ghanaians | 2.1 /100 | #236 | Tragic 63.5% |
| Comanche | 2.1 /100 | #237 | Tragic 63.5% |
| Immigrants | Zimbabwe | 2.0 /100 | #238 | Tragic 63.5% |
| Aleuts | 1.9 /100 | #239 | Tragic 63.4% |
| South Africans | 1.9 /100 | #240 | Tragic 63.4% |
| Immigrants | St. Vincent and the Grenadines | 1.9 /100 | #241 | Tragic 63.4% |
| Immigrants | Israel | 1.8 /100 | #242 | Tragic 63.4% |
| Immigrants | Czechoslovakia | 1.8 /100 | #243 | Tragic 63.4% |
| Eastern Europeans | 1.6 /100 | #244 | Tragic 63.4% |
| Immigrants | Dominica | 1.6 /100 | #245 | Tragic 63.4% |
| Immigrants | Ghana | 1.6 /100 | #246 | Tragic 63.4% |
| Immigrants | Uzbekistan | 1.5 /100 | #247 | Tragic 63.4% |
| Dominicans | 1.5 /100 | #248 | Tragic 63.4% |
| Russians | 1.4 /100 | #249 | Tragic 63.4% |
| Immigrants | Japan | 1.4 /100 | #250 | Tragic 63.4% |