Sierra Leonean vs Immigrants from Bulgaria Family Households
COMPARE
Sierra Leonean
Immigrants from Bulgaria
Family Households
Family Households Comparison
Sierra Leoneans
Immigrants from Bulgaria
63.9%
FAMILY HOUSEHOLDS
11.2/ 100
METRIC RATING
209th/ 347
METRIC RANK
63.0%
FAMILY HOUSEHOLDS
0.2/ 100
METRIC RATING
280th/ 347
METRIC RANK
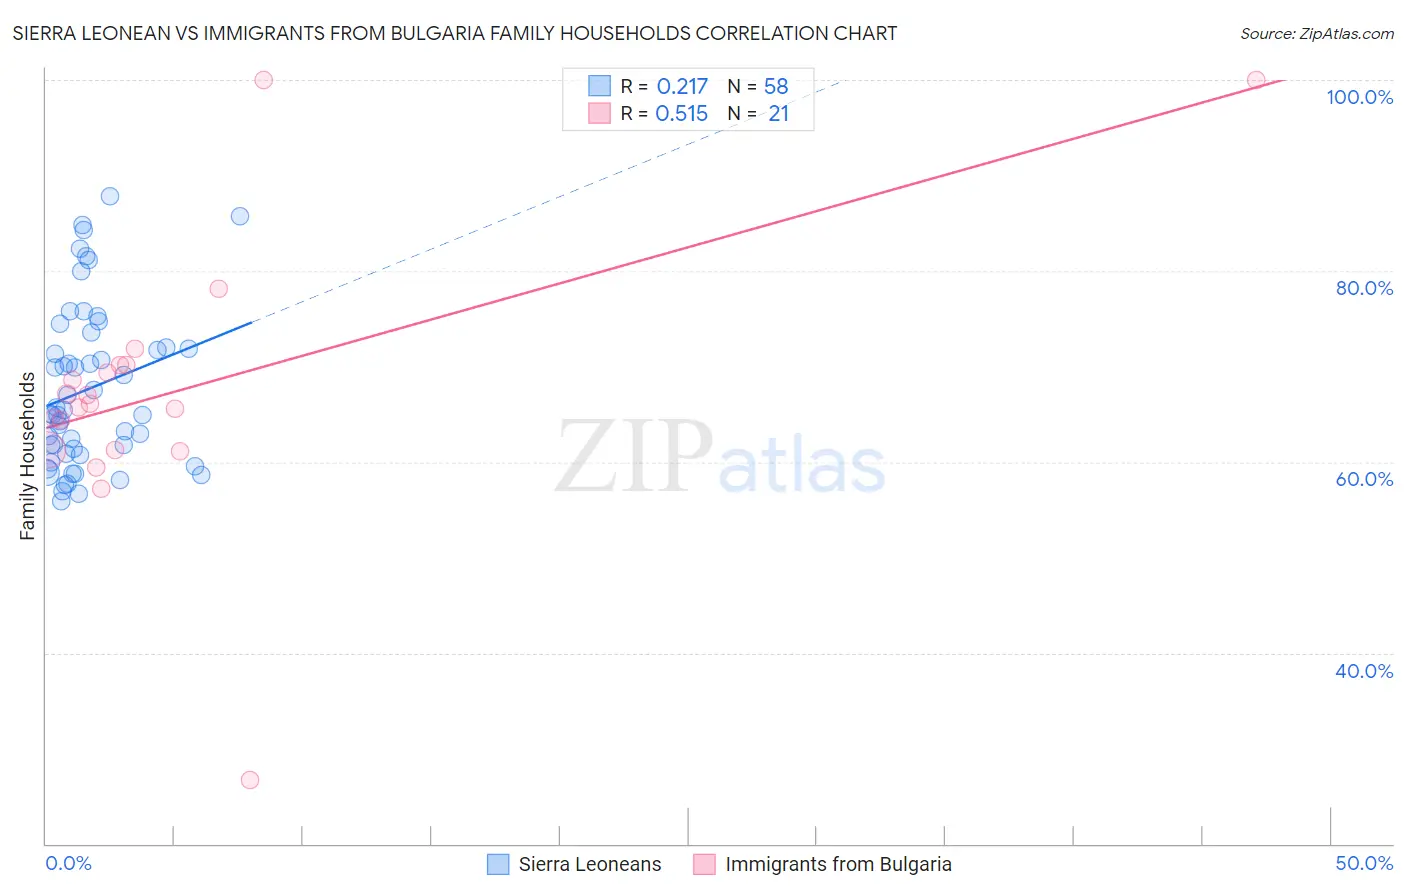
Sierra Leonean vs Immigrants from Bulgaria Family Households Correlation Chart
The statistical analysis conducted on geographies consisting of 83,352,562 people shows a weak positive correlation between the proportion of Sierra Leoneans and percentage of family households in the United States with a correlation coefficient (R) of 0.217 and weighted average of 63.9%. Similarly, the statistical analysis conducted on geographies consisting of 172,541,029 people shows a substantial positive correlation between the proportion of Immigrants from Bulgaria and percentage of family households in the United States with a correlation coefficient (R) of 0.515 and weighted average of 63.0%, a difference of 1.4%.
Family Households Correlation Summary
| Measurement | Sierra Leonean | Immigrants from Bulgaria |
| Minimum | 55.9% | 26.6% |
| Maximum | 87.8% | 100.0% |
| Range | 31.8% | 73.4% |
| Mean | 67.7% | 67.4% |
| Median | 65.2% | 66.1% |
| Interquartile 25% (IQ1) | 60.8% | 61.2% |
| Interquartile 75% (IQ3) | 72.0% | 70.1% |
| Interquartile Range (IQR) | 11.2% | 8.9% |
| Standard Deviation (Sample) | 8.4% | 14.6% |
| Standard Deviation (Population) | 8.4% | 14.2% |
Similar Demographics by Family Households
Demographics Similar to Sierra Leoneans by Family Households
In terms of family households, the demographic groups most similar to Sierra Leoneans are Nigerian (63.9%, a difference of 0.010%), Immigrants from Bangladesh (63.9%, a difference of 0.010%), Immigrants from Lithuania (63.9%, a difference of 0.030%), Brazilian (63.9%, a difference of 0.040%), and Immigrants from Uruguay (63.9%, a difference of 0.050%).
| Demographics | Rating | Rank | Family Households |
| Iranians | 13.5 /100 | #202 | Poor 63.9% |
| Norwegians | 13.2 /100 | #203 | Poor 63.9% |
| Immigrants | Uruguay | 12.8 /100 | #204 | Poor 63.9% |
| Brazilians | 12.4 /100 | #205 | Poor 63.9% |
| Immigrants | Lithuania | 12.1 /100 | #206 | Poor 63.9% |
| Nigerians | 11.5 /100 | #207 | Poor 63.9% |
| Immigrants | Bangladesh | 11.4 /100 | #208 | Poor 63.9% |
| Sierra Leoneans | 11.2 /100 | #209 | Poor 63.9% |
| Immigrants | Thailand | 9.6 /100 | #210 | Tragic 63.8% |
| Shoshone | 9.4 /100 | #211 | Tragic 63.8% |
| Immigrants | Netherlands | 9.4 /100 | #212 | Tragic 63.8% |
| Immigrants | Northern Europe | 8.8 /100 | #213 | Tragic 63.8% |
| Celtics | 8.0 /100 | #214 | Tragic 63.8% |
| Belgians | 7.6 /100 | #215 | Tragic 63.8% |
| Croatians | 7.3 /100 | #216 | Tragic 63.8% |
Demographics Similar to Immigrants from Bulgaria by Family Households
In terms of family households, the demographic groups most similar to Immigrants from Bulgaria are Immigrants from Yemen (63.0%, a difference of 0.010%), Immigrants from Belgium (63.0%, a difference of 0.050%), Ottawa (63.0%, a difference of 0.090%), Estonian (62.9%, a difference of 0.090%), and New Zealander (62.9%, a difference of 0.13%).
| Demographics | Rating | Rank | Family Households |
| Immigrants | Kazakhstan | 0.3 /100 | #273 | Tragic 63.1% |
| Lumbee | 0.3 /100 | #274 | Tragic 63.1% |
| West Indians | 0.3 /100 | #275 | Tragic 63.1% |
| Serbians | 0.3 /100 | #276 | Tragic 63.0% |
| Ottawa | 0.3 /100 | #277 | Tragic 63.0% |
| Immigrants | Belgium | 0.2 /100 | #278 | Tragic 63.0% |
| Immigrants | Yemen | 0.2 /100 | #279 | Tragic 63.0% |
| Immigrants | Bulgaria | 0.2 /100 | #280 | Tragic 63.0% |
| Estonians | 0.2 /100 | #281 | Tragic 62.9% |
| New Zealanders | 0.1 /100 | #282 | Tragic 62.9% |
| Immigrants | Denmark | 0.1 /100 | #283 | Tragic 62.9% |
| Australians | 0.1 /100 | #284 | Tragic 62.8% |
| Mongolians | 0.1 /100 | #285 | Tragic 62.8% |
| British West Indians | 0.1 /100 | #286 | Tragic 62.8% |
| Latvians | 0.1 /100 | #287 | Tragic 62.8% |