Sierra Leonean vs Bulgarian Family Households
COMPARE
Sierra Leonean
Bulgarian
Family Households
Family Households Comparison
Sierra Leoneans
Bulgarians
63.9%
FAMILY HOUSEHOLDS
11.2/ 100
METRIC RATING
209th/ 347
METRIC RANK
63.6%
FAMILY HOUSEHOLDS
3.4/ 100
METRIC RATING
229th/ 347
METRIC RANK
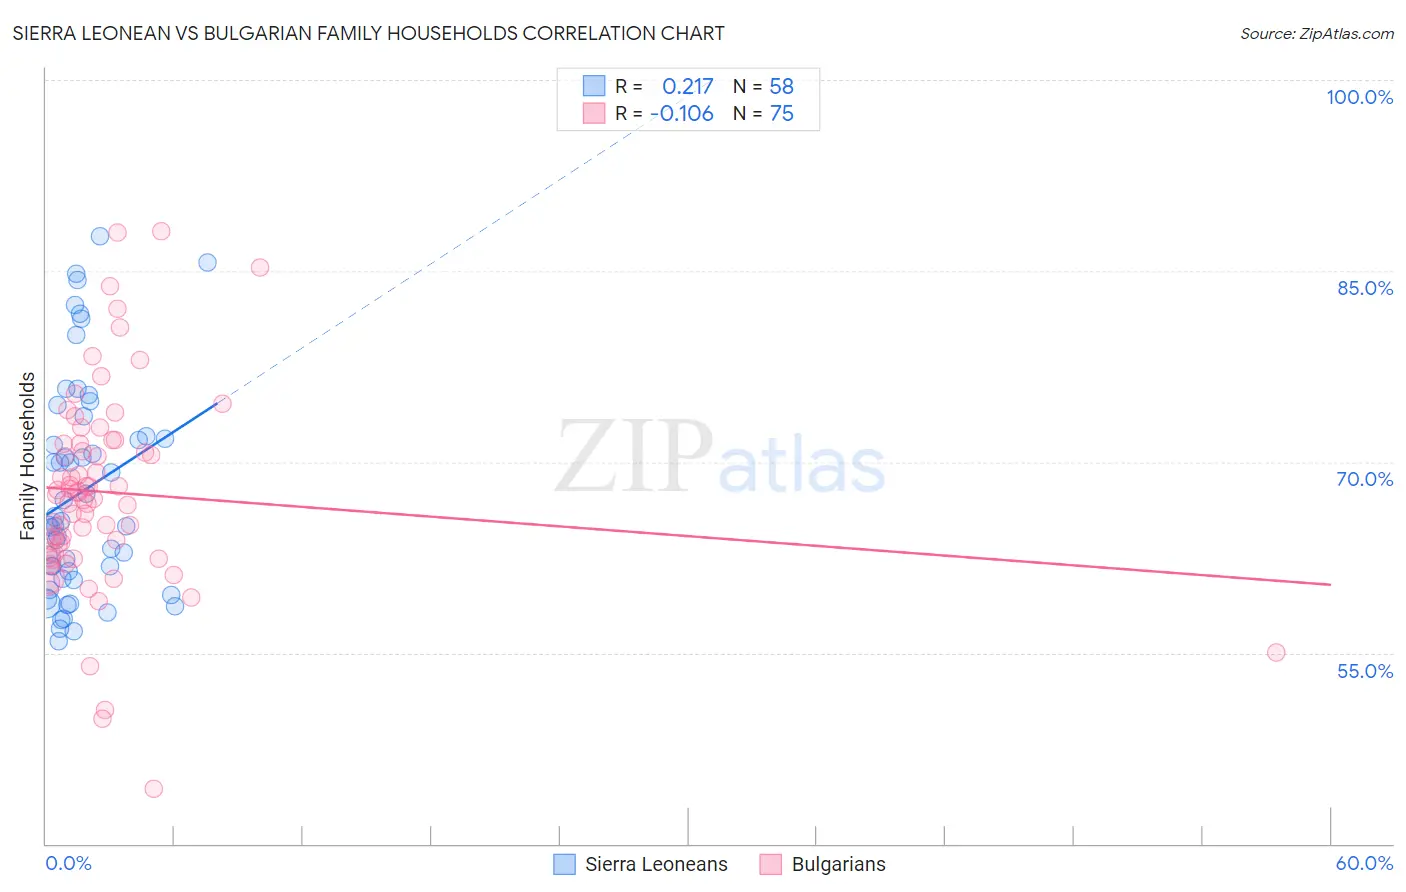
Sierra Leonean vs Bulgarian Family Households Correlation Chart
The statistical analysis conducted on geographies consisting of 83,352,562 people shows a weak positive correlation between the proportion of Sierra Leoneans and percentage of family households in the United States with a correlation coefficient (R) of 0.217 and weighted average of 63.9%. Similarly, the statistical analysis conducted on geographies consisting of 205,566,238 people shows a poor negative correlation between the proportion of Bulgarians and percentage of family households in the United States with a correlation coefficient (R) of -0.106 and weighted average of 63.6%, a difference of 0.43%.
Family Households Correlation Summary
| Measurement | Sierra Leonean | Bulgarian |
| Minimum | 55.9% | 44.3% |
| Maximum | 87.8% | 88.1% |
| Range | 31.8% | 43.8% |
| Mean | 67.7% | 67.6% |
| Median | 65.2% | 67.4% |
| Interquartile 25% (IQ1) | 60.8% | 62.8% |
| Interquartile 75% (IQ3) | 72.0% | 71.5% |
| Interquartile Range (IQR) | 11.2% | 8.7% |
| Standard Deviation (Sample) | 8.4% | 8.0% |
| Standard Deviation (Population) | 8.4% | 7.9% |
Demographics Similar to Sierra Leoneans and Bulgarians by Family Households
In terms of family households, the demographic groups most similar to Sierra Leoneans are Immigrants from Thailand (63.8%, a difference of 0.060%), Shoshone (63.8%, a difference of 0.070%), Immigrants from Netherlands (63.8%, a difference of 0.070%), Immigrants from Northern Europe (63.8%, a difference of 0.090%), and Celtic (63.8%, a difference of 0.13%). Similarly, the demographic groups most similar to Bulgarians are Blackfeet (63.6%, a difference of 0.020%), Immigrants from Bahamas (63.6%, a difference of 0.070%), Trinidadian and Tobagonian (63.6%, a difference of 0.070%), Immigrants from Hungary (63.6%, a difference of 0.080%), and Turkish (63.6%, a difference of 0.10%).
| Demographics | Rating | Rank | Family Households |
| Sierra Leoneans | 11.2 /100 | #209 | Poor 63.9% |
| Immigrants | Thailand | 9.6 /100 | #210 | Tragic 63.8% |
| Shoshone | 9.4 /100 | #211 | Tragic 63.8% |
| Immigrants | Netherlands | 9.4 /100 | #212 | Tragic 63.8% |
| Immigrants | Northern Europe | 8.8 /100 | #213 | Tragic 63.8% |
| Celtics | 8.0 /100 | #214 | Tragic 63.8% |
| Belgians | 7.6 /100 | #215 | Tragic 63.8% |
| Croatians | 7.3 /100 | #216 | Tragic 63.8% |
| Osage | 7.0 /100 | #217 | Tragic 63.7% |
| Marshallese | 6.9 /100 | #218 | Tragic 63.7% |
| Macedonians | 6.5 /100 | #219 | Tragic 63.7% |
| Immigrants | Europe | 6.4 /100 | #220 | Tragic 63.7% |
| Immigrants | South Africa | 5.9 /100 | #221 | Tragic 63.7% |
| Immigrants | Belarus | 5.5 /100 | #222 | Tragic 63.7% |
| French Canadians | 5.4 /100 | #223 | Tragic 63.7% |
| Turks | 4.5 /100 | #224 | Tragic 63.6% |
| Immigrants | Hungary | 4.3 /100 | #225 | Tragic 63.6% |
| Immigrants | Bahamas | 4.2 /100 | #226 | Tragic 63.6% |
| Trinidadians and Tobagonians | 4.1 /100 | #227 | Tragic 63.6% |
| Blackfeet | 3.6 /100 | #228 | Tragic 63.6% |
| Bulgarians | 3.4 /100 | #229 | Tragic 63.6% |