Serbian vs Iranian Family Households
COMPARE
Serbian
Iranian
Family Households
Family Households Comparison
Serbians
Iranians
63.0%
FAMILY HOUSEHOLDS
0.3/ 100
METRIC RATING
276th/ 347
METRIC RANK
63.9%
FAMILY HOUSEHOLDS
13.5/ 100
METRIC RATING
202nd/ 347
METRIC RANK
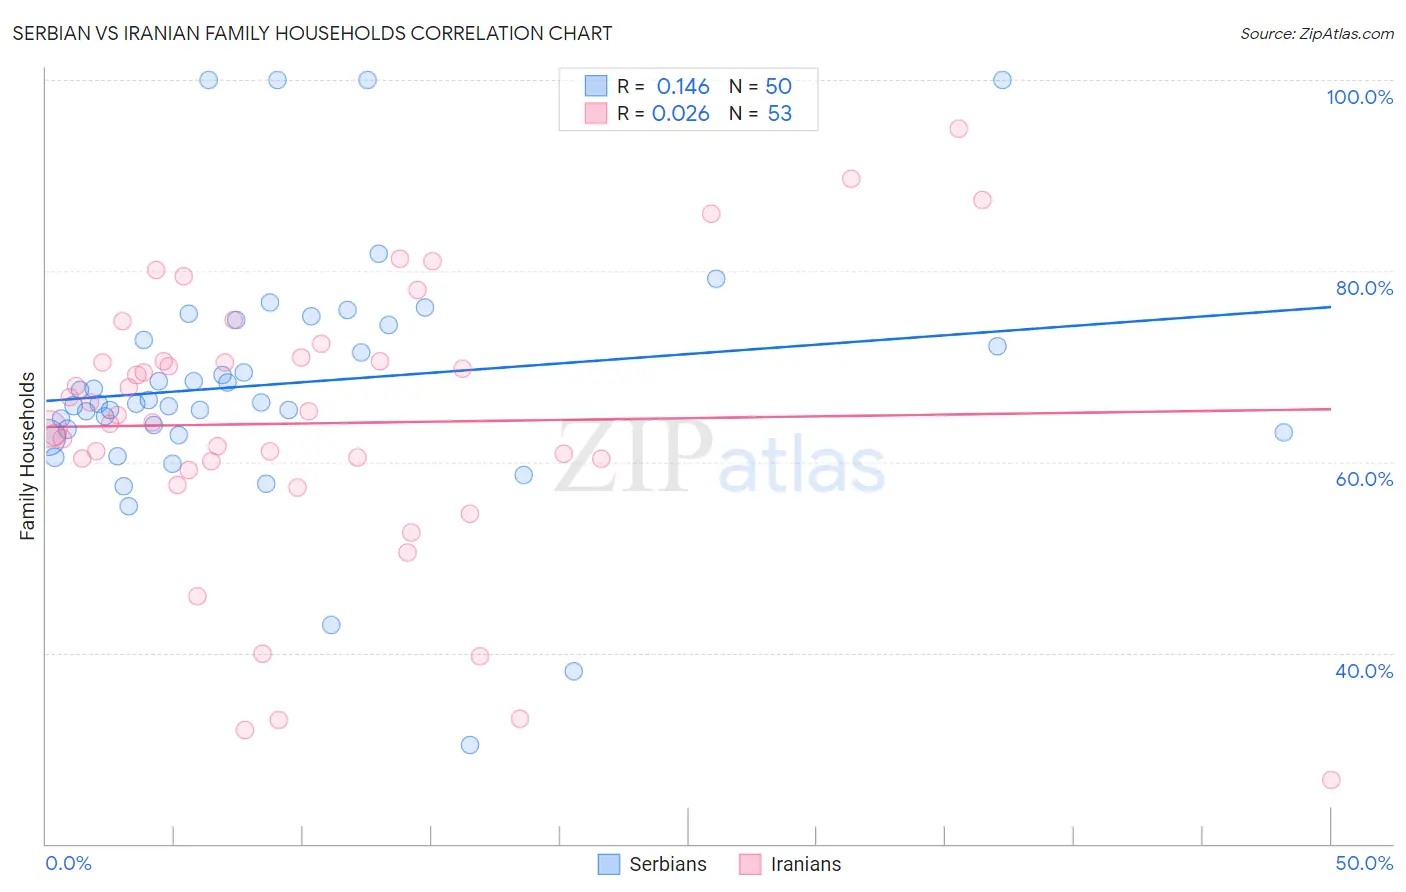
Serbian vs Iranian Family Households Correlation Chart
The statistical analysis conducted on geographies consisting of 267,533,115 people shows a poor positive correlation between the proportion of Serbians and percentage of family households in the United States with a correlation coefficient (R) of 0.146 and weighted average of 63.0%. Similarly, the statistical analysis conducted on geographies consisting of 316,654,989 people shows no correlation between the proportion of Iranians and percentage of family households in the United States with a correlation coefficient (R) of 0.026 and weighted average of 63.9%, a difference of 1.3%.
Family Households Correlation Summary
| Measurement | Serbian | Iranian |
| Minimum | 30.3% | 26.7% |
| Maximum | 100.0% | 94.9% |
| Range | 69.7% | 68.2% |
| Mean | 68.2% | 64.0% |
| Median | 66.2% | 64.9% |
| Interquartile 25% (IQ1) | 63.0% | 59.6% |
| Interquartile 75% (IQ3) | 74.4% | 70.7% |
| Interquartile Range (IQR) | 11.3% | 11.2% |
| Standard Deviation (Sample) | 13.3% | 14.6% |
| Standard Deviation (Population) | 13.2% | 14.4% |
Similar Demographics by Family Households
Demographics Similar to Serbians by Family Households
In terms of family households, the demographic groups most similar to Serbians are Lumbee (63.1%, a difference of 0.010%), West Indian (63.1%, a difference of 0.010%), Immigrants from Kazakhstan (63.1%, a difference of 0.020%), Immigrants from Croatia (63.1%, a difference of 0.030%), and Immigrants from Turkey (63.1%, a difference of 0.030%).
| Demographics | Rating | Rank | Family Households |
| Yugoslavians | 0.4 /100 | #269 | Tragic 63.1% |
| Immigrants | Austria | 0.3 /100 | #270 | Tragic 63.1% |
| Immigrants | Croatia | 0.3 /100 | #271 | Tragic 63.1% |
| Immigrants | Turkey | 0.3 /100 | #272 | Tragic 63.1% |
| Immigrants | Kazakhstan | 0.3 /100 | #273 | Tragic 63.1% |
| Lumbee | 0.3 /100 | #274 | Tragic 63.1% |
| West Indians | 0.3 /100 | #275 | Tragic 63.1% |
| Serbians | 0.3 /100 | #276 | Tragic 63.0% |
| Ottawa | 0.3 /100 | #277 | Tragic 63.0% |
| Immigrants | Belgium | 0.2 /100 | #278 | Tragic 63.0% |
| Immigrants | Yemen | 0.2 /100 | #279 | Tragic 63.0% |
| Immigrants | Bulgaria | 0.2 /100 | #280 | Tragic 63.0% |
| Estonians | 0.2 /100 | #281 | Tragic 62.9% |
| New Zealanders | 0.1 /100 | #282 | Tragic 62.9% |
| Immigrants | Denmark | 0.1 /100 | #283 | Tragic 62.9% |
Demographics Similar to Iranians by Family Households
In terms of family households, the demographic groups most similar to Iranians are Norwegian (63.9%, a difference of 0.010%), Immigrants from Uruguay (63.9%, a difference of 0.020%), Brazilian (63.9%, a difference of 0.030%), Immigrants from Lithuania (63.9%, a difference of 0.040%), and Nigerian (63.9%, a difference of 0.060%).
| Demographics | Rating | Rank | Family Households |
| Immigrants | North America | 20.0 /100 | #195 | Poor 64.0% |
| Immigrants | Canada | 19.2 /100 | #196 | Poor 64.0% |
| Seminole | 18.9 /100 | #197 | Poor 64.0% |
| Poles | 18.9 /100 | #198 | Poor 64.0% |
| Slavs | 18.6 /100 | #199 | Poor 64.0% |
| Immigrants | Malaysia | 17.9 /100 | #200 | Poor 64.0% |
| Immigrants | Eastern Europe | 17.2 /100 | #201 | Poor 64.0% |
| Iranians | 13.5 /100 | #202 | Poor 63.9% |
| Norwegians | 13.2 /100 | #203 | Poor 63.9% |
| Immigrants | Uruguay | 12.8 /100 | #204 | Poor 63.9% |
| Brazilians | 12.4 /100 | #205 | Poor 63.9% |
| Immigrants | Lithuania | 12.1 /100 | #206 | Poor 63.9% |
| Nigerians | 11.5 /100 | #207 | Poor 63.9% |
| Immigrants | Bangladesh | 11.4 /100 | #208 | Poor 63.9% |
| Sierra Leoneans | 11.2 /100 | #209 | Poor 63.9% |