Serbian vs Danish Householder Income Ages 25 - 44 years
COMPARE
Serbian
Danish
Householder Income Ages 25 - 44 years
Householder Income Ages 25 - 44 years Comparison
Serbians
Danes
$98,320
HOUSEHOLDER INCOME AGES 25 - 44 YEARS
88.9/ 100
METRIC RATING
127th/ 347
METRIC RANK
$97,221
HOUSEHOLDER INCOME AGES 25 - 44 YEARS
81.3/ 100
METRIC RATING
142nd/ 347
METRIC RANK
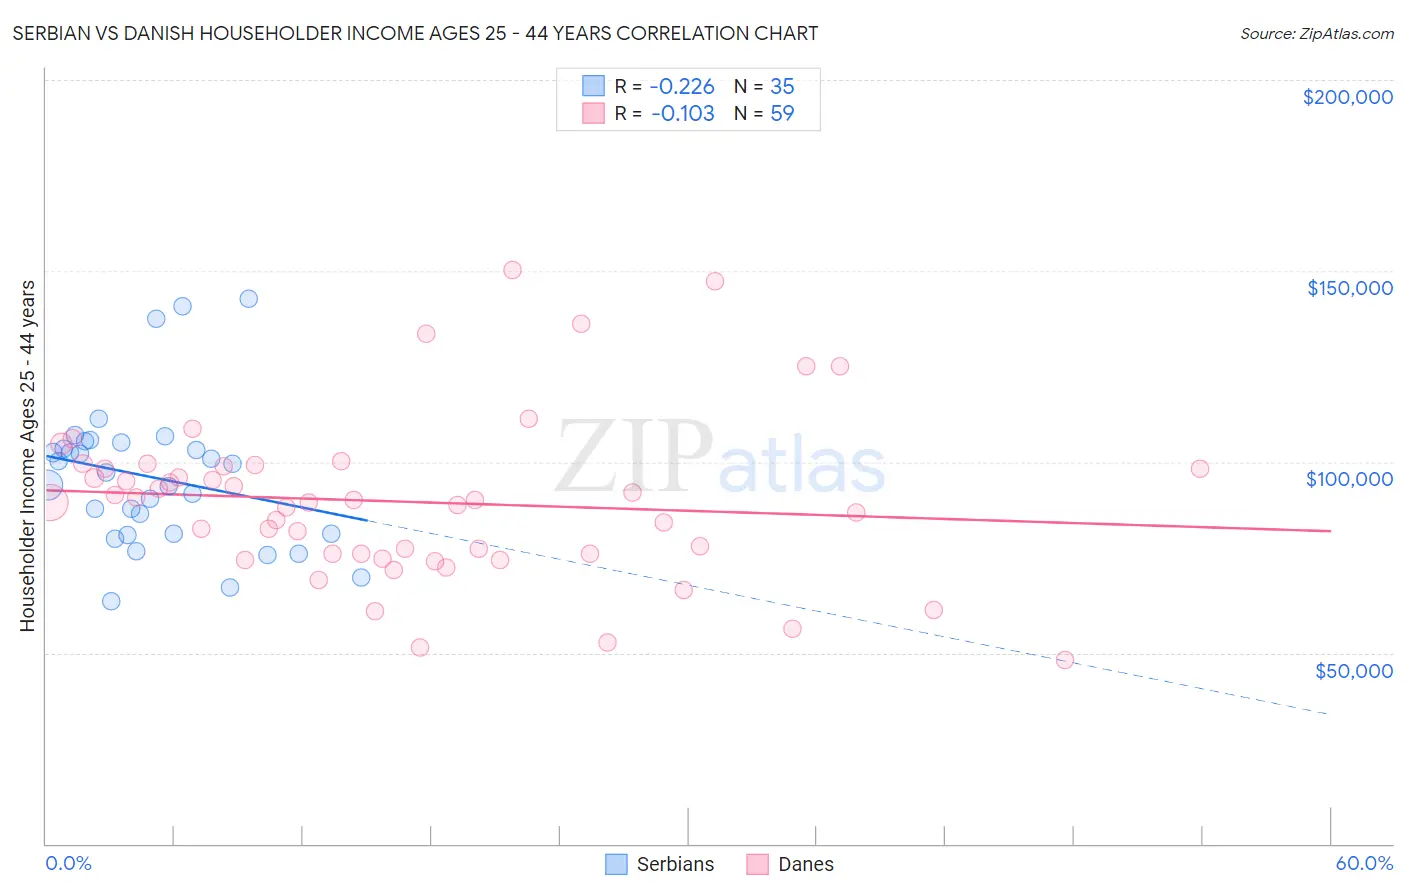
Serbian vs Danish Householder Income Ages 25 - 44 years Correlation Chart
The statistical analysis conducted on geographies consisting of 267,013,776 people shows a weak negative correlation between the proportion of Serbians and household income with householder between the ages 25 and 44 in the United States with a correlation coefficient (R) of -0.226 and weighted average of $98,320. Similarly, the statistical analysis conducted on geographies consisting of 471,956,523 people shows a poor negative correlation between the proportion of Danes and household income with householder between the ages 25 and 44 in the United States with a correlation coefficient (R) of -0.103 and weighted average of $97,221, a difference of 1.1%.
Householder Income Ages 25 - 44 years Correlation Summary
| Measurement | Serbian | Danish |
| Minimum | $63,450 | $48,125 |
| Maximum | $142,843 | $150,222 |
| Range | $79,393 | $102,097 |
| Mean | $95,911 | $89,539 |
| Median | $97,346 | $89,288 |
| Interquartile 25% (IQ1) | $81,016 | $75,783 |
| Interquartile 75% (IQ3) | $104,913 | $98,883 |
| Interquartile Range (IQR) | $23,897 | $23,100 |
| Standard Deviation (Sample) | $18,723 | $21,492 |
| Standard Deviation (Population) | $18,453 | $21,309 |
Demographics Similar to Serbians and Danes by Householder Income Ages 25 - 44 years
In terms of householder income ages 25 - 44 years, the demographic groups most similar to Serbians are European ($98,310, a difference of 0.010%), British ($98,359, a difference of 0.040%), Brazilian ($98,267, a difference of 0.050%), Pakistani ($98,401, a difference of 0.080%), and Immigrants from Kuwait ($98,122, a difference of 0.20%). Similarly, the demographic groups most similar to Danes are Luxembourger ($97,237, a difference of 0.020%), Immigrants from Jordan ($97,185, a difference of 0.040%), Immigrants from Chile ($97,159, a difference of 0.060%), Immigrants from Morocco ($97,305, a difference of 0.090%), and Immigrants from Peru ($97,329, a difference of 0.11%).
| Demographics | Rating | Rank | Householder Income Ages 25 - 44 years |
| Zimbabweans | 90.3 /100 | #124 | Exceptional $98,586 |
| Pakistanis | 89.3 /100 | #125 | Excellent $98,401 |
| British | 89.1 /100 | #126 | Excellent $98,359 |
| Serbians | 88.9 /100 | #127 | Excellent $98,320 |
| Europeans | 88.9 /100 | #128 | Excellent $98,310 |
| Brazilians | 88.6 /100 | #129 | Excellent $98,267 |
| Immigrants | Kuwait | 87.8 /100 | #130 | Excellent $98,122 |
| Immigrants | Albania | 86.6 /100 | #131 | Excellent $97,929 |
| Immigrants | Zimbabwe | 86.3 /100 | #132 | Excellent $97,880 |
| Tsimshian | 85.8 /100 | #133 | Excellent $97,809 |
| Canadians | 84.5 /100 | #134 | Excellent $97,625 |
| Immigrants | Oceania | 84.5 /100 | #135 | Excellent $97,623 |
| Hungarians | 83.9 /100 | #136 | Excellent $97,544 |
| Lebanese | 82.3 /100 | #137 | Excellent $97,339 |
| Arabs | 82.3 /100 | #138 | Excellent $97,336 |
| Immigrants | Peru | 82.2 /100 | #139 | Excellent $97,329 |
| Immigrants | Morocco | 82.0 /100 | #140 | Excellent $97,305 |
| Luxembourgers | 81.5 /100 | #141 | Excellent $97,237 |
| Danes | 81.3 /100 | #142 | Excellent $97,221 |
| Immigrants | Jordan | 81.0 /100 | #143 | Excellent $97,185 |
| Immigrants | Chile | 80.8 /100 | #144 | Excellent $97,159 |