Serbian vs Immigrants from Iraq Family Households

COMPARE

Serbian
Race
Ancestry
AfghanAfricanAlaska NativeAlaskan AthabascanAlbanianAleutAlsatianAmericanApacheArabArapahoArgentineanArmenianAssyrian/Chaldean/SyriacAustralianAustrianBahamianBangladeshiBarbadianBasqueBelgianBelizeanBermudanBhutaneseBlackfeetBolivianBrazilianBritishBritish West IndianBulgarianBurmeseCajunCambodianCanadianCape VerdeanCarpatho RusynCelticCentral AmericanCentral American IndianCherokeeCheyenneChickasawChileanChineseChippewaChoctawColombianColvilleComancheCosta RicanCreeCreekCroatianCrowCubanCypriotCzechCzechoslovakianDanishDelawareDominicanDutchDutch West IndianEastern EuropeanEcuadorianEgyptianEnglishEstonianEthiopianEuropeanFijianFilipinoFinnishFrenchFrench American IndianFrench CanadianGermanGerman RussianGhanaianGreekGuamanian/ChamorroGuatemalanGuyaneseHaitianHmongHonduranHopiHoumaHungarianIcelanderIndian (Asian)IndonesianInupiatIranianIraqiIrishIroquoisIsraeliItalianJamaicanJapaneseJordanianKenyanKiowaKoreanLaotianLatvianLebaneseLiberianLithuanianLumbeeLuxembourgerMacedonianMalaysianMalteseMarshalleseMenomineeMexicanMexican American IndianMongolianMoroccanNative HawaiianNavajoNepaleseNew ZealanderNicaraguanNigerianNorthern EuropeanNorwegianOkinawanOsageOttawaPaiutePakistaniPalestinianPanamanianParaguayanPennsylvania GermanPeruvianPimaPolishPortuguesePotawatomiPuebloPuerto RicanPuget Sound SalishRomanianRussianSalvadoranSamoanScandinavianScotch-IrishScottishSeminoleSenegaleseSerbianShoshoneSierra LeoneanSiouxSlavicSlovakSloveneSomaliSouth AfricanSouth AmericanSouth American IndianSoviet UnionSpaniardSpanishSpanish AmericanSpanish American IndianSri LankanSubsaharan AfricanSudaneseSwedishSwissSyrianTaiwaneseThaiTlingit-HaidaTohono O'OdhamTonganTrinidadian and TobagonianTsimshianTurkishU.S. Virgin IslanderUgandanUkrainianUruguayanUteVenezuelanVietnameseWelshWest IndianYakamaYaquiYugoslavianYumanYup'ikZimbabwean
Immigration
NonimmigrantsImmigrantsAfghanistanAfricaAlbaniaArgentinaArmeniaAsiaAustraliaAustriaBahamasBangladeshBarbadosBelarusBelgiumBelizeBoliviaBosnia and HerzegovinaBrazilBulgariaBurma/MyanmarCabo VerdeCambodiaCameroonCanadaCaribbeanCentral AmericaChileChinaColombiaCongoCosta RicaCroatiaCubaCzechoslovakiaDenmarkDominicaDominican RepublicEastern AfricaEastern AsiaEastern EuropeEcuadorEgyptEl SalvadorEnglandEritreaEthiopiaEuropeFijiFranceGermanyGhanaGreeceGrenadaGuatemalaGuyanaHaitiHondurasHong KongHungaryIndiaIndonesiaIranIrelandIsraelItalyJamaicaJapanJordanKazakhstanKenyaKoreaKuwaitLaosLatin AmericaLatviaLebanonLiberiaLithuaniaMalaysiaMexicoMicronesiaMiddle AfricaMoldovaMoroccoNepalNetherlandsNicaraguaNigeriaNorth AmericaNorth MacedoniaNorthern AfricaNorthern EuropeNorwayOceaniaPakistanPanamaPeruPhilippinesPolandPortugalRomaniaRussiaSaudi ArabiaScotlandSenegalSerbiaSierra LeoneSingaporeSomaliaSouth AfricaSouth AmericaSouth Central AsiaSouth Eastern AsiaSouthern EuropeSpainSri LankaSt. Vincent and the GrenadinesSudanSwedenSwitzerlandSyriaTaiwanThailandTrinidad and TobagoTurkeyUgandaUkraineUruguayUzbekistanVenezuelaVietnamWest IndiesWestern AfricaWestern AsiaWestern EuropeYemenZaireZimbabweAzores
Immigrants from Iraq
Race
Ancestry
AfghanAfricanAlaska NativeAlaskan AthabascanAlbanianAleutAlsatianAmericanApacheArabArapahoArgentineanArmenianAssyrian/Chaldean/SyriacAustralianAustrianBahamianBangladeshiBarbadianBasqueBelgianBelizeanBermudanBhutaneseBlackfeetBolivianBrazilianBritishBritish West IndianBulgarianBurmeseCajunCambodianCanadianCape VerdeanCarpatho RusynCelticCentral AmericanCentral American IndianCherokeeCheyenneChickasawChileanChineseChippewaChoctawColombianColvilleComancheCosta RicanCreeCreekCroatianCrowCubanCypriotCzechCzechoslovakianDanishDelawareDominicanDutchDutch West IndianEastern EuropeanEcuadorianEgyptianEnglishEstonianEthiopianEuropeanFijianFilipinoFinnishFrenchFrench American IndianFrench CanadianGermanGerman RussianGhanaianGreekGuamanian/ChamorroGuatemalanGuyaneseHaitianHmongHonduranHopiHoumaHungarianIcelanderIndian (Asian)IndonesianInupiatIranianIraqiIrishIroquoisIsraeliItalianJamaicanJapaneseJordanianKenyanKiowaKoreanLaotianLatvianLebaneseLiberianLithuanianLumbeeLuxembourgerMacedonianMalaysianMalteseMarshalleseMenomineeMexicanMexican American IndianMongolianMoroccanNative HawaiianNavajoNepaleseNew ZealanderNicaraguanNigerianNorthern EuropeanNorwegianOkinawanOsageOttawaPaiutePakistaniPalestinianPanamanianParaguayanPennsylvania GermanPeruvianPimaPolishPortuguesePotawatomiPuebloPuerto RicanPuget Sound SalishRomanianRussianSalvadoranSamoanScandinavianScotch-IrishScottishSeminoleSenegaleseShoshoneSierra LeoneanSiouxSlavicSlovakSloveneSomaliSouth AfricanSouth AmericanSouth American IndianSoviet UnionSpaniardSpanishSpanish AmericanSpanish American IndianSri LankanSubsaharan AfricanSudaneseSwedishSwissSyrianTaiwaneseThaiTlingit-HaidaTohono O'OdhamTonganTrinidadian and TobagonianTsimshianTurkishU.S. Virgin IslanderUgandanUkrainianUruguayanUteVenezuelanVietnameseWelshWest IndianYakamaYaquiYugoslavianYumanYup'ikZimbabwean
Immigration
NonimmigrantsImmigrantsAfghanistanAfricaAlbaniaArgentinaArmeniaAsiaAustraliaAustriaBahamasBangladeshBarbadosBelarusBelgiumBelizeBoliviaBosnia and HerzegovinaBrazilBulgariaBurma/MyanmarCabo VerdeCambodiaCameroonCanadaCaribbeanCentral AmericaChileChinaColombiaCongoCosta RicaCroatiaCubaCzechoslovakiaDenmarkDominicaDominican RepublicEastern AfricaEastern AsiaEastern EuropeEcuadorEgyptEl SalvadorEnglandEritreaEthiopiaEuropeFijiFranceGermanyGhanaGreeceGrenadaGuatemalaGuyanaHaitiHondurasHong KongHungaryIndiaIndonesiaIranIraqIrelandIsraelItalyJamaicaJapanJordanKazakhstanKenyaKoreaKuwaitLaosLatin AmericaLatviaLebanonLiberiaLithuaniaMalaysiaMexicoMicronesiaMiddle AfricaMoldovaMoroccoNepalNetherlandsNicaraguaNigeriaNorth AmericaNorth MacedoniaNorthern AfricaNorthern EuropeNorwayOceaniaPakistanPanamaPeruPhilippinesPolandPortugalRomaniaRussiaSaudi ArabiaScotlandSenegalSerbiaSierra LeoneSingaporeSomaliaSouth AfricaSouth AmericaSouth Central AsiaSouth Eastern AsiaSouthern EuropeSpainSri LankaSt. Vincent and the GrenadinesSudanSwedenSwitzerlandSyriaTaiwanThailandTrinidad and TobagoTurkeyUgandaUkraineUruguayUzbekistanVenezuelaVietnamWest IndiesWestern AfricaWestern AsiaWestern EuropeYemenZaireZimbabweAzores
Family Households
Income
Poverty
Unemployment
Labor Participation
Family Structure
Vehicle Availability
Education Level
Disability

Family Households Comparison

Serbians

Immigrants from Iraq

Tragic
Exceptional
63.0%
FAMILY HOUSEHOLDS
0.3/ 100
METRIC RATING
276th/ 347
METRIC RANK
65.0%
FAMILY HOUSEHOLDS
95.4/ 100
METRIC RATING
116th/ 347
METRIC RANK

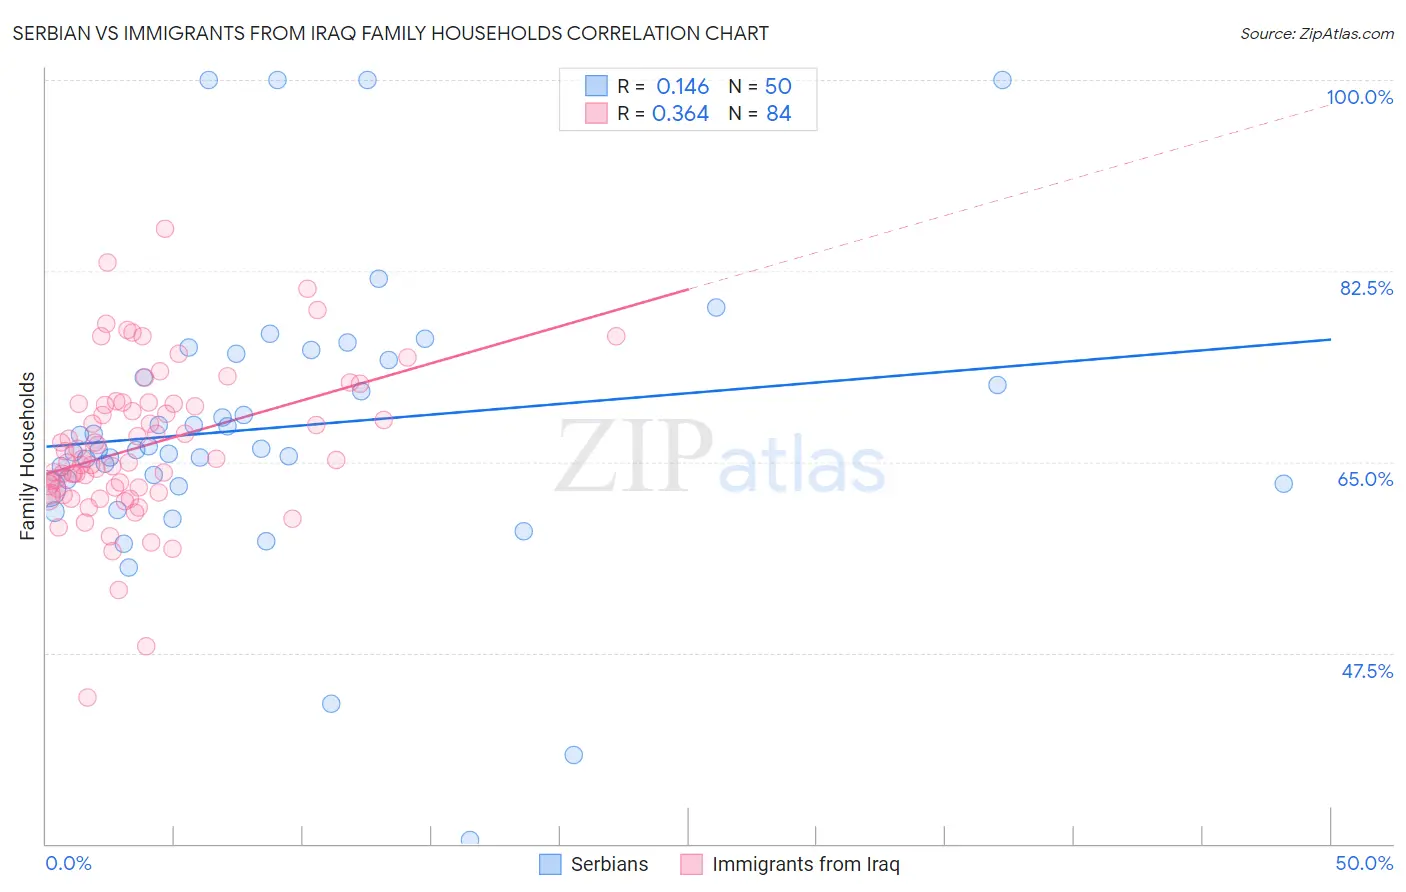
Serbian vs Immigrants from Iraq Family Households Correlation Chart

The statistical analysis conducted on geographies consisting of 267,533,115 people shows a poor positive correlation between the proportion of Serbians and percentage of family households in the United States with a correlation coefficient (R) of 0.146 and weighted average of 63.0%. Similarly, the statistical analysis conducted on geographies consisting of 194,748,040 people shows a mild positive correlation between the proportion of Immigrants from Iraq and percentage of family households in the United States with a correlation coefficient (R) of 0.364 and weighted average of 65.0%, a difference of 3.0%.
Serbian vs Immigrants from Iraq Family Households

Family Households Correlation Summary

MeasurementSerbianImmigrants from Iraq
Minimum30.3%43.4%
Maximum100.0%86.3%
Range69.7%43.0%
Mean68.2%66.4%
Median66.2%65.2%
Interquartile 25% (IQ1)63.0%62.3%
Interquartile 75% (IQ3)74.4%70.4%
Interquartile Range (IQR)11.3%8.0%
Standard Deviation (Sample)13.3%7.1%
Standard Deviation (Population)13.2%7.0%

Similar Demographics by Family Households

Demographics Similar to Serbians by Family Households

In terms of family households, the demographic groups most similar to Serbians are Lumbee (63.1%, a difference of 0.010%), West Indian (63.1%, a difference of 0.010%), Immigrants from Kazakhstan (63.1%, a difference of 0.020%), Immigrants from Croatia (63.1%, a difference of 0.030%), and Immigrants from Turkey (63.1%, a difference of 0.030%).
DemographicsRating | RankFamily Households
Yugoslavians
0.4
/100
|
#269
Tragic
63.1%
Immigrants | Austria
0.3
/100
|
#270
Tragic
63.1%
Immigrants | Croatia
0.3
/100
|
#271
Tragic
63.1%
Immigrants | Turkey
0.3
/100
|
#272
Tragic
63.1%
Immigrants | Kazakhstan
0.3
/100
|
#273
Tragic
63.1%
Lumbee
0.3
/100
|
#274
Tragic
63.1%
West Indians
0.3
/100
|
#275
Tragic
63.1%
Serbians
0.3
/100
|
#276
Tragic
63.0%
Ottawa
0.3
/100
|
#277
Tragic
63.0%
Immigrants | Belgium
0.2
/100
|
#278
Tragic
63.0%
Immigrants | Yemen
0.2
/100
|
#279
Tragic
63.0%
Immigrants | Bulgaria
0.2
/100
|
#280
Tragic
63.0%
Estonians
0.2
/100
|
#281
Tragic
62.9%
New Zealanders
0.1
/100
|
#282
Tragic
62.9%
Immigrants | Denmark
0.1
/100
|
#283
Tragic
62.9%

Demographics Similar to Immigrants from Iraq by Family Households

In terms of family households, the demographic groups most similar to Immigrants from Iraq are Ecuadorian (65.0%, a difference of 0.0%), Cherokee (65.0%, a difference of 0.0%), Dutch (64.9%, a difference of 0.020%), Argentinean (65.0%, a difference of 0.030%), and Spanish (65.0%, a difference of 0.070%).
DemographicsRating | RankFamily Households
Immigrants | Guatemala
96.9
/100
|
#109
Exceptional
65.0%
Scandinavians
96.8
/100
|
#110
Exceptional
65.0%
Europeans
96.8
/100
|
#111
Exceptional
65.0%
Immigrants | Jordan
96.5
/100
|
#112
Exceptional
65.0%
Spanish
96.2
/100
|
#113
Exceptional
65.0%
Argentineans
95.7
/100
|
#114
Exceptional
65.0%
Ecuadorians
95.4
/100
|
#115
Exceptional
65.0%
Immigrants | Iraq
95.4
/100
|
#116
Exceptional
65.0%
Cherokee
95.3
/100
|
#117
Exceptional
65.0%
Dutch
95.1
/100
|
#118
Exceptional
64.9%
Immigrants | Eastern Asia
94.4
/100
|
#119
Exceptional
64.9%
Immigrants | Oceania
94.2
/100
|
#120
Exceptional
64.9%
Hungarians
94.0
/100
|
#121
Exceptional
64.9%
Hmong
93.4
/100
|
#122
Exceptional
64.9%
Choctaw
93.4
/100
|
#123
Exceptional
64.9%