Senegalese vs Palestinian Single Mother Households
COMPARE
Senegalese
Palestinian
Single Mother Households
Single Mother Households Comparison
Senegalese
Palestinians
8.2%
SINGLE MOTHER HOUSEHOLDS
0.0/ 100
METRIC RATING
318th/ 347
METRIC RANK
5.9%
SINGLE MOTHER HOUSEHOLDS
92.1/ 100
METRIC RATING
130th/ 347
METRIC RANK
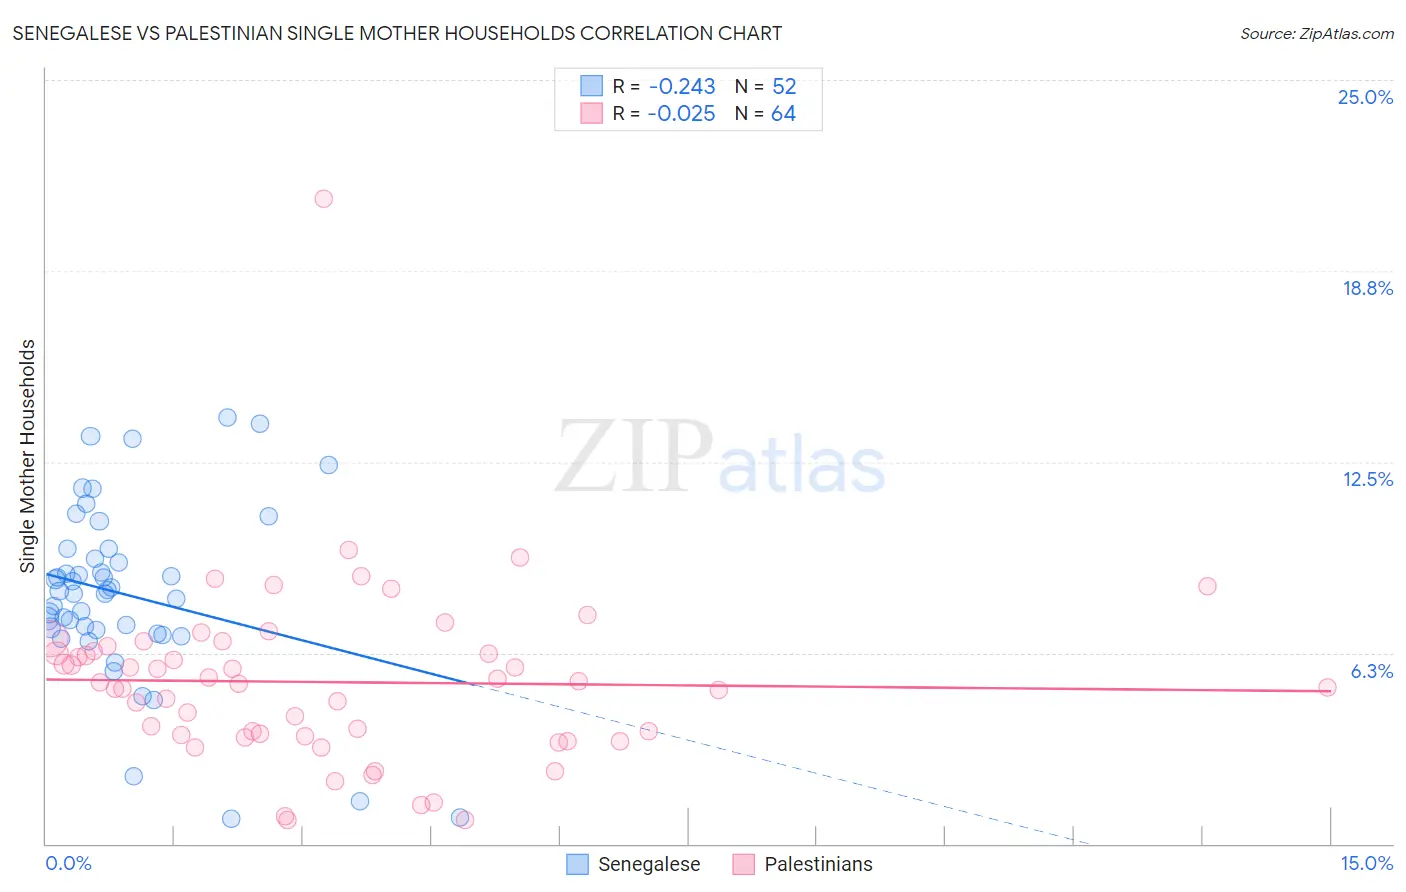
Senegalese vs Palestinian Single Mother Households Correlation Chart
The statistical analysis conducted on geographies consisting of 78,081,080 people shows a weak negative correlation between the proportion of Senegalese and percentage of single mother households in the United States with a correlation coefficient (R) of -0.243 and weighted average of 8.2%. Similarly, the statistical analysis conducted on geographies consisting of 216,255,094 people shows no correlation between the proportion of Palestinians and percentage of single mother households in the United States with a correlation coefficient (R) of -0.025 and weighted average of 5.9%, a difference of 39.9%.
Single Mother Households Correlation Summary
| Measurement | Senegalese | Palestinian |
| Minimum | 0.81% | 0.78% |
| Maximum | 13.9% | 21.1% |
| Range | 13.1% | 20.3% |
| Mean | 8.2% | 5.3% |
| Median | 8.2% | 5.3% |
| Interquartile 25% (IQ1) | 6.9% | 3.5% |
| Interquartile 75% (IQ3) | 9.5% | 6.4% |
| Interquartile Range (IQR) | 2.5% | 2.8% |
| Standard Deviation (Sample) | 2.9% | 2.9% |
| Standard Deviation (Population) | 2.9% | 2.9% |
Similar Demographics by Single Mother Households
Demographics Similar to Senegalese by Single Mother Households
In terms of single mother households, the demographic groups most similar to Senegalese are Jamaican (8.2%, a difference of 0.11%), Bahamian (8.3%, a difference of 0.23%), Immigrants from Senegal (8.3%, a difference of 0.47%), Pima (8.3%, a difference of 0.55%), and Immigrants from Honduras (8.2%, a difference of 0.56%).
| Demographics | Rating | Rank | Single Mother Households |
| Immigrants | Congo | 0.0 /100 | #311 | Tragic 8.1% |
| Bangladeshis | 0.0 /100 | #312 | Tragic 8.1% |
| Immigrants | Grenada | 0.0 /100 | #313 | Tragic 8.2% |
| Immigrants | Mexico | 0.0 /100 | #314 | Tragic 8.2% |
| Immigrants | Western Africa | 0.0 /100 | #315 | Tragic 8.2% |
| Africans | 0.0 /100 | #316 | Tragic 8.2% |
| Immigrants | Honduras | 0.0 /100 | #317 | Tragic 8.2% |
| Senegalese | 0.0 /100 | #318 | Tragic 8.2% |
| Jamaicans | 0.0 /100 | #319 | Tragic 8.2% |
| Bahamians | 0.0 /100 | #320 | Tragic 8.3% |
| Immigrants | Senegal | 0.0 /100 | #321 | Tragic 8.3% |
| Pima | 0.0 /100 | #322 | Tragic 8.3% |
| Haitians | 0.0 /100 | #323 | Tragic 8.3% |
| Immigrants | Jamaica | 0.0 /100 | #324 | Tragic 8.4% |
| Immigrants | Caribbean | 0.0 /100 | #325 | Tragic 8.4% |
Demographics Similar to Palestinians by Single Mother Households
In terms of single mother households, the demographic groups most similar to Palestinians are Immigrants from Bolivia (5.9%, a difference of 0.030%), Czechoslovakian (5.9%, a difference of 0.040%), Lebanese (5.9%, a difference of 0.12%), Welsh (5.9%, a difference of 0.30%), and Slavic (5.9%, a difference of 0.33%).
| Demographics | Rating | Rank | Single Mother Households |
| Immigrants | Uzbekistan | 93.4 /100 | #123 | Exceptional 5.9% |
| Immigrants | Argentina | 93.2 /100 | #124 | Exceptional 5.9% |
| Slavs | 92.9 /100 | #125 | Exceptional 5.9% |
| Welsh | 92.8 /100 | #126 | Exceptional 5.9% |
| Lebanese | 92.4 /100 | #127 | Exceptional 5.9% |
| Czechoslovakians | 92.2 /100 | #128 | Exceptional 5.9% |
| Immigrants | Bolivia | 92.2 /100 | #129 | Exceptional 5.9% |
| Palestinians | 92.1 /100 | #130 | Exceptional 5.9% |
| Immigrants | Spain | 91.2 /100 | #131 | Exceptional 5.9% |
| Albanians | 91.1 /100 | #132 | Exceptional 5.9% |
| Egyptians | 90.7 /100 | #133 | Exceptional 5.9% |
| Canadians | 90.5 /100 | #134 | Exceptional 5.9% |
| Immigrants | Saudi Arabia | 90.2 /100 | #135 | Exceptional 5.9% |
| Jordanians | 88.9 /100 | #136 | Excellent 6.0% |
| Immigrants | Pakistan | 88.4 /100 | #137 | Excellent 6.0% |