Senegalese vs Creek Single Mother Households
COMPARE
Senegalese
Creek
Single Mother Households
Single Mother Households Comparison
Senegalese
Creek
8.2%
SINGLE MOTHER HOUSEHOLDS
0.0/ 100
METRIC RATING
318th/ 347
METRIC RANK
7.0%
SINGLE MOTHER HOUSEHOLDS
1.6/ 100
METRIC RATING
230th/ 347
METRIC RANK
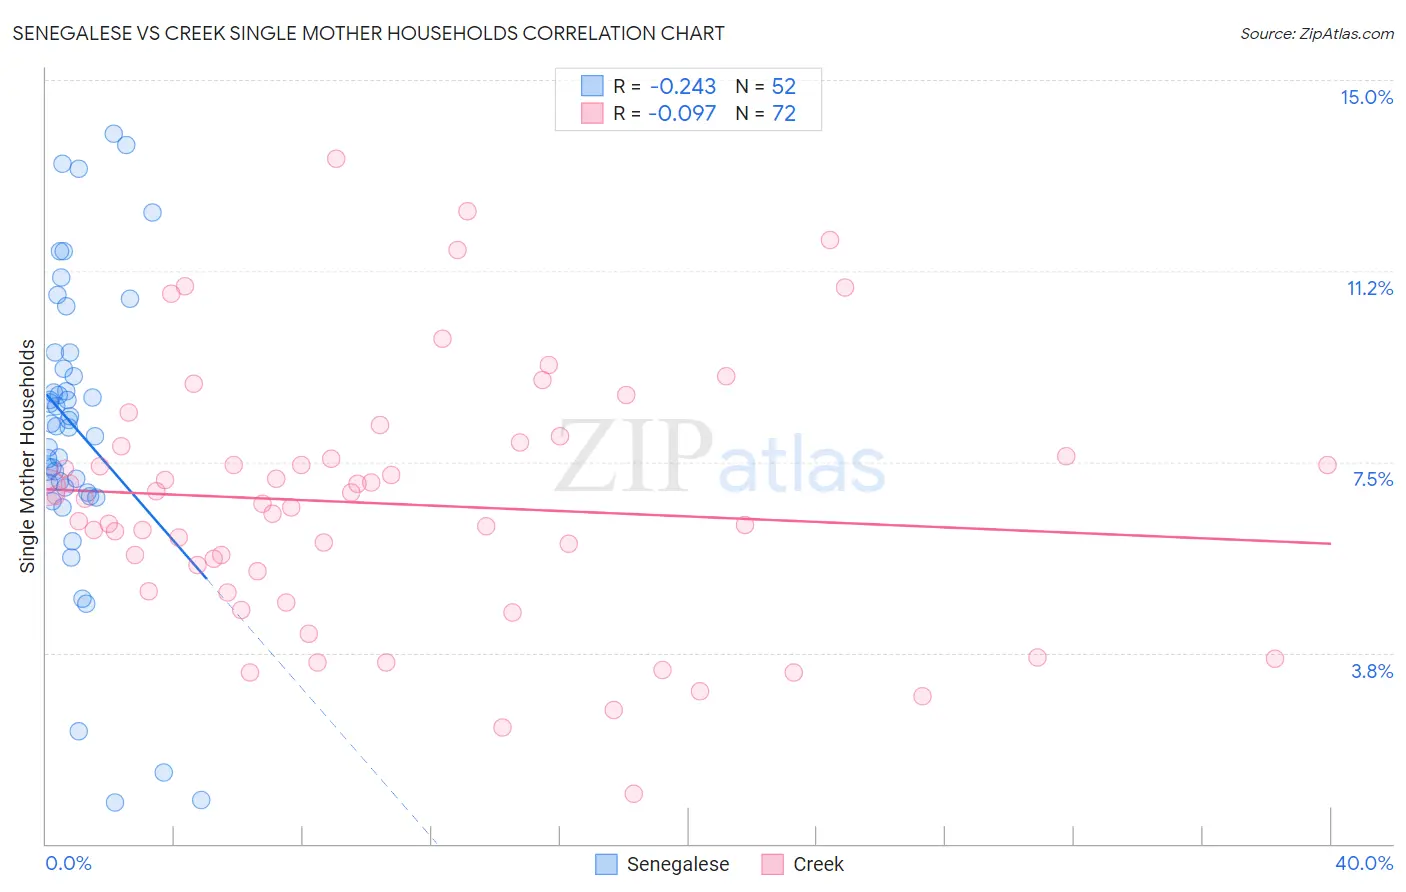
Senegalese vs Creek Single Mother Households Correlation Chart
The statistical analysis conducted on geographies consisting of 78,081,080 people shows a weak negative correlation between the proportion of Senegalese and percentage of single mother households in the United States with a correlation coefficient (R) of -0.243 and weighted average of 8.2%. Similarly, the statistical analysis conducted on geographies consisting of 178,256,539 people shows a slight negative correlation between the proportion of Creek and percentage of single mother households in the United States with a correlation coefficient (R) of -0.097 and weighted average of 7.0%, a difference of 17.2%.
Single Mother Households Correlation Summary
| Measurement | Senegalese | Creek |
| Minimum | 0.81% | 0.97% |
| Maximum | 13.9% | 13.4% |
| Range | 13.1% | 12.5% |
| Mean | 8.2% | 6.7% |
| Median | 8.2% | 6.7% |
| Interquartile 25% (IQ1) | 6.9% | 5.1% |
| Interquartile 75% (IQ3) | 9.5% | 7.7% |
| Interquartile Range (IQR) | 2.5% | 2.6% |
| Standard Deviation (Sample) | 2.9% | 2.5% |
| Standard Deviation (Population) | 2.9% | 2.5% |
Similar Demographics by Single Mother Households
Demographics Similar to Senegalese by Single Mother Households
In terms of single mother households, the demographic groups most similar to Senegalese are Jamaican (8.2%, a difference of 0.11%), Bahamian (8.3%, a difference of 0.23%), Immigrants from Senegal (8.3%, a difference of 0.47%), Pima (8.3%, a difference of 0.55%), and Immigrants from Honduras (8.2%, a difference of 0.56%).
| Demographics | Rating | Rank | Single Mother Households |
| Immigrants | Congo | 0.0 /100 | #311 | Tragic 8.1% |
| Bangladeshis | 0.0 /100 | #312 | Tragic 8.1% |
| Immigrants | Grenada | 0.0 /100 | #313 | Tragic 8.2% |
| Immigrants | Mexico | 0.0 /100 | #314 | Tragic 8.2% |
| Immigrants | Western Africa | 0.0 /100 | #315 | Tragic 8.2% |
| Africans | 0.0 /100 | #316 | Tragic 8.2% |
| Immigrants | Honduras | 0.0 /100 | #317 | Tragic 8.2% |
| Senegalese | 0.0 /100 | #318 | Tragic 8.2% |
| Jamaicans | 0.0 /100 | #319 | Tragic 8.2% |
| Bahamians | 0.0 /100 | #320 | Tragic 8.3% |
| Immigrants | Senegal | 0.0 /100 | #321 | Tragic 8.3% |
| Pima | 0.0 /100 | #322 | Tragic 8.3% |
| Haitians | 0.0 /100 | #323 | Tragic 8.3% |
| Immigrants | Jamaica | 0.0 /100 | #324 | Tragic 8.4% |
| Immigrants | Caribbean | 0.0 /100 | #325 | Tragic 8.4% |
Demographics Similar to Creek by Single Mother Households
In terms of single mother households, the demographic groups most similar to Creek are Spanish American (7.0%, a difference of 0.020%), Comanche (7.0%, a difference of 0.080%), Choctaw (7.0%, a difference of 0.25%), Chickasaw (7.0%, a difference of 0.27%), and Immigrants from Burma/Myanmar (7.0%, a difference of 0.34%).
| Demographics | Rating | Rank | Single Mother Households |
| Immigrants | Micronesia | 3.6 /100 | #223 | Tragic 6.9% |
| Immigrants | Sudan | 3.5 /100 | #224 | Tragic 6.9% |
| Sudanese | 3.1 /100 | #225 | Tragic 6.9% |
| Paiute | 2.4 /100 | #226 | Tragic 7.0% |
| Kenyans | 2.3 /100 | #227 | Tragic 7.0% |
| Iroquois | 2.2 /100 | #228 | Tragic 7.0% |
| Immigrants | Kenya | 2.1 /100 | #229 | Tragic 7.0% |
| Creek | 1.6 /100 | #230 | Tragic 7.0% |
| Spanish Americans | 1.6 /100 | #231 | Tragic 7.0% |
| Comanche | 1.5 /100 | #232 | Tragic 7.0% |
| Choctaw | 1.4 /100 | #233 | Tragic 7.0% |
| Chickasaw | 1.4 /100 | #234 | Tragic 7.0% |
| Immigrants | Burma/Myanmar | 1.4 /100 | #235 | Tragic 7.0% |
| Ute | 1.0 /100 | #236 | Tragic 7.1% |
| Arapaho | 1.0 /100 | #237 | Tragic 7.1% |