Crow vs Palestinian Single Mother Households
COMPARE
Crow
Palestinian
Single Mother Households
Single Mother Households Comparison
Crow
Palestinians
7.4%
SINGLE MOTHER HOUSEHOLDS
0.1/ 100
METRIC RATING
265th/ 347
METRIC RANK
5.9%
SINGLE MOTHER HOUSEHOLDS
92.1/ 100
METRIC RATING
130th/ 347
METRIC RANK
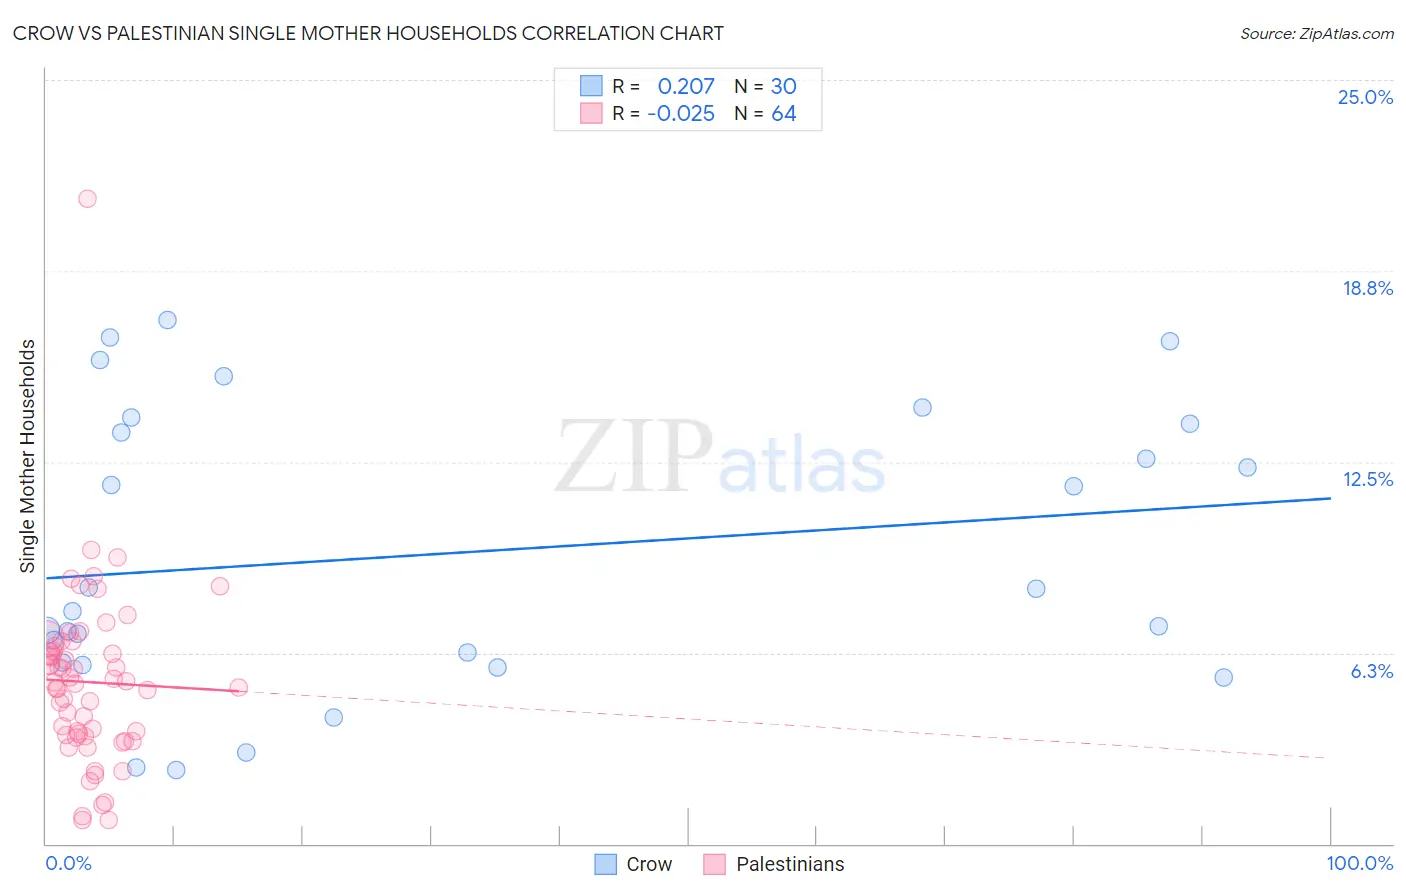
Crow vs Palestinian Single Mother Households Correlation Chart
The statistical analysis conducted on geographies consisting of 59,176,023 people shows a weak positive correlation between the proportion of Crow and percentage of single mother households in the United States with a correlation coefficient (R) of 0.207 and weighted average of 7.4%. Similarly, the statistical analysis conducted on geographies consisting of 216,255,094 people shows no correlation between the proportion of Palestinians and percentage of single mother households in the United States with a correlation coefficient (R) of -0.025 and weighted average of 5.9%, a difference of 26.5%.
Single Mother Households Correlation Summary
| Measurement | Crow | Palestinian |
| Minimum | 2.4% | 0.78% |
| Maximum | 17.1% | 21.1% |
| Range | 14.8% | 20.3% |
| Mean | 9.5% | 5.3% |
| Median | 8.0% | 5.3% |
| Interquartile 25% (IQ1) | 5.9% | 3.5% |
| Interquartile 75% (IQ3) | 13.8% | 6.4% |
| Interquartile Range (IQR) | 7.8% | 2.8% |
| Standard Deviation (Sample) | 4.6% | 2.9% |
| Standard Deviation (Population) | 4.5% | 2.9% |
Similar Demographics by Single Mother Households
Demographics Similar to Crow by Single Mother Households
In terms of single mother households, the demographic groups most similar to Crow are Nepalese (7.5%, a difference of 0.090%), Yaqui (7.4%, a difference of 0.18%), Immigrants from Nicaragua (7.4%, a difference of 0.25%), Immigrants from Somalia (7.4%, a difference of 0.40%), and Blackfeet (7.5%, a difference of 0.43%).
| Demographics | Rating | Rank | Single Mother Households |
| Pueblo | 0.2 /100 | #258 | Tragic 7.4% |
| Immigrants | Yemen | 0.2 /100 | #259 | Tragic 7.4% |
| Immigrants | Zaire | 0.2 /100 | #260 | Tragic 7.4% |
| Japanese | 0.2 /100 | #261 | Tragic 7.4% |
| Immigrants | Somalia | 0.2 /100 | #262 | Tragic 7.4% |
| Immigrants | Nicaragua | 0.2 /100 | #263 | Tragic 7.4% |
| Yaqui | 0.1 /100 | #264 | Tragic 7.4% |
| Crow | 0.1 /100 | #265 | Tragic 7.4% |
| Nepalese | 0.1 /100 | #266 | Tragic 7.5% |
| Blackfeet | 0.1 /100 | #267 | Tragic 7.5% |
| Indonesians | 0.1 /100 | #268 | Tragic 7.5% |
| Somalis | 0.1 /100 | #269 | Tragic 7.5% |
| Immigrants | Cuba | 0.1 /100 | #270 | Tragic 7.5% |
| Salvadorans | 0.1 /100 | #271 | Tragic 7.5% |
| Immigrants | Azores | 0.1 /100 | #272 | Tragic 7.5% |
Demographics Similar to Palestinians by Single Mother Households
In terms of single mother households, the demographic groups most similar to Palestinians are Immigrants from Bolivia (5.9%, a difference of 0.030%), Czechoslovakian (5.9%, a difference of 0.040%), Lebanese (5.9%, a difference of 0.12%), Welsh (5.9%, a difference of 0.30%), and Slavic (5.9%, a difference of 0.33%).
| Demographics | Rating | Rank | Single Mother Households |
| Immigrants | Uzbekistan | 93.4 /100 | #123 | Exceptional 5.9% |
| Immigrants | Argentina | 93.2 /100 | #124 | Exceptional 5.9% |
| Slavs | 92.9 /100 | #125 | Exceptional 5.9% |
| Welsh | 92.8 /100 | #126 | Exceptional 5.9% |
| Lebanese | 92.4 /100 | #127 | Exceptional 5.9% |
| Czechoslovakians | 92.2 /100 | #128 | Exceptional 5.9% |
| Immigrants | Bolivia | 92.2 /100 | #129 | Exceptional 5.9% |
| Palestinians | 92.1 /100 | #130 | Exceptional 5.9% |
| Immigrants | Spain | 91.2 /100 | #131 | Exceptional 5.9% |
| Albanians | 91.1 /100 | #132 | Exceptional 5.9% |
| Egyptians | 90.7 /100 | #133 | Exceptional 5.9% |
| Canadians | 90.5 /100 | #134 | Exceptional 5.9% |
| Immigrants | Saudi Arabia | 90.2 /100 | #135 | Exceptional 5.9% |
| Jordanians | 88.9 /100 | #136 | Excellent 6.0% |
| Immigrants | Pakistan | 88.4 /100 | #137 | Excellent 6.0% |