Immigrants from Caribbean vs Palestinian Single Mother Households
COMPARE
Immigrants from Caribbean
Palestinian
Single Mother Households
Single Mother Households Comparison
Immigrants from Caribbean
Palestinians
8.4%
SINGLE MOTHER HOUSEHOLDS
0.0/ 100
METRIC RATING
325th/ 347
METRIC RANK
5.9%
SINGLE MOTHER HOUSEHOLDS
92.1/ 100
METRIC RATING
130th/ 347
METRIC RANK
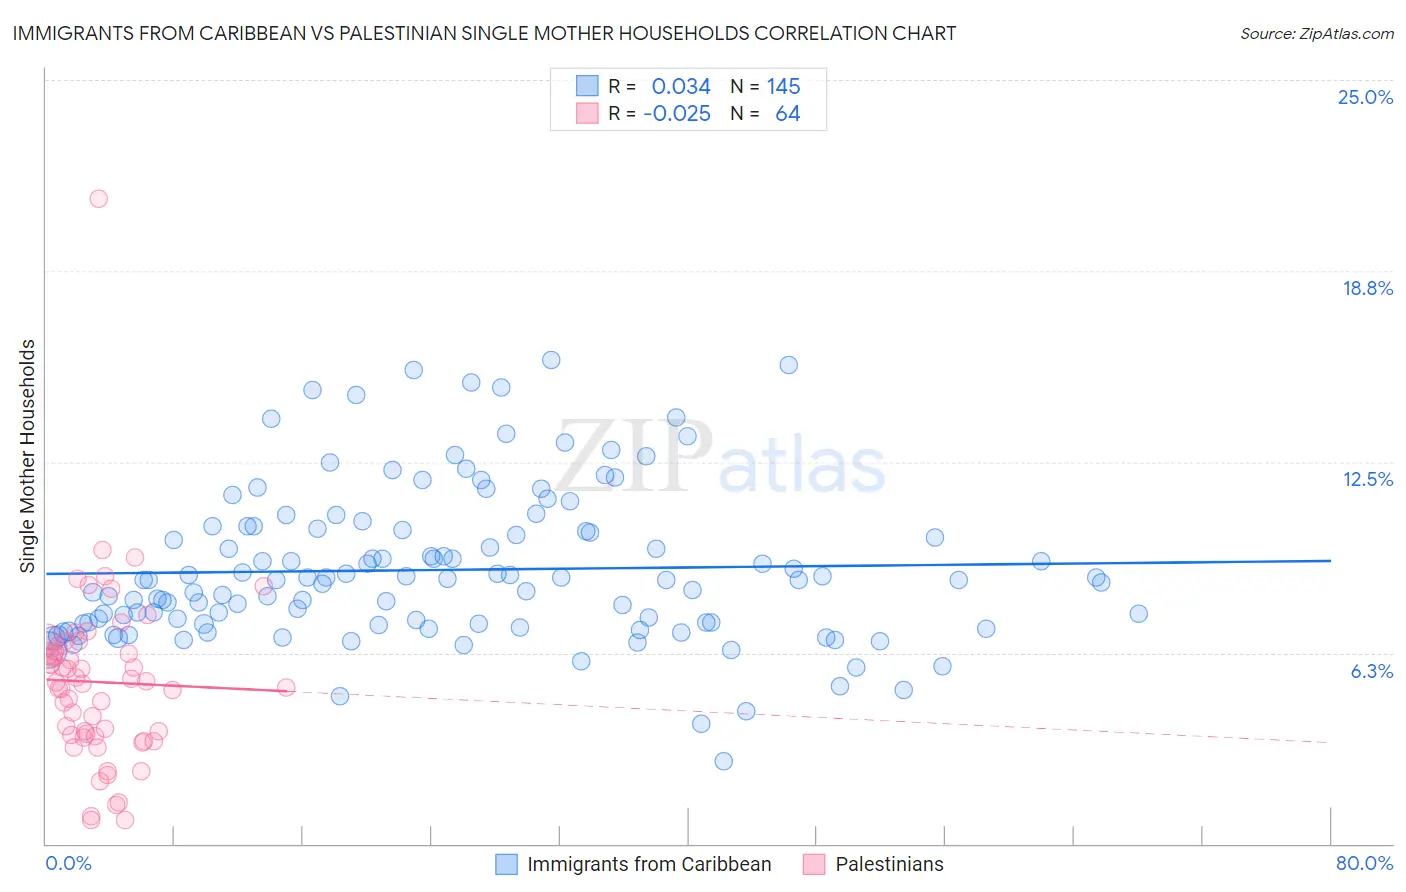
Immigrants from Caribbean vs Palestinian Single Mother Households Correlation Chart
The statistical analysis conducted on geographies consisting of 448,351,427 people shows no correlation between the proportion of Immigrants from Caribbean and percentage of single mother households in the United States with a correlation coefficient (R) of 0.034 and weighted average of 8.4%. Similarly, the statistical analysis conducted on geographies consisting of 216,255,094 people shows no correlation between the proportion of Palestinians and percentage of single mother households in the United States with a correlation coefficient (R) of -0.025 and weighted average of 5.9%, a difference of 42.3%.
Single Mother Households Correlation Summary
| Measurement | Immigrants from Caribbean | Palestinian |
| Minimum | 2.7% | 0.78% |
| Maximum | 15.8% | 21.1% |
| Range | 13.1% | 20.3% |
| Mean | 9.0% | 5.3% |
| Median | 8.6% | 5.3% |
| Interquartile 25% (IQ1) | 7.2% | 3.5% |
| Interquartile 75% (IQ3) | 10.3% | 6.4% |
| Interquartile Range (IQR) | 3.1% | 2.8% |
| Standard Deviation (Sample) | 2.5% | 2.9% |
| Standard Deviation (Population) | 2.5% | 2.9% |
Similar Demographics by Single Mother Households
Demographics Similar to Immigrants from Caribbean by Single Mother Households
In terms of single mother households, the demographic groups most similar to Immigrants from Caribbean are British West Indian (8.4%, a difference of 0.12%), Immigrants from Jamaica (8.4%, a difference of 0.18%), Immigrants from Haiti (8.4%, a difference of 0.27%), Yakama (8.4%, a difference of 0.45%), and Haitian (8.3%, a difference of 0.61%).
| Demographics | Rating | Rank | Single Mother Households |
| Senegalese | 0.0 /100 | #318 | Tragic 8.2% |
| Jamaicans | 0.0 /100 | #319 | Tragic 8.2% |
| Bahamians | 0.0 /100 | #320 | Tragic 8.3% |
| Immigrants | Senegal | 0.0 /100 | #321 | Tragic 8.3% |
| Pima | 0.0 /100 | #322 | Tragic 8.3% |
| Haitians | 0.0 /100 | #323 | Tragic 8.3% |
| Immigrants | Jamaica | 0.0 /100 | #324 | Tragic 8.4% |
| Immigrants | Caribbean | 0.0 /100 | #325 | Tragic 8.4% |
| British West Indians | 0.0 /100 | #326 | Tragic 8.4% |
| Immigrants | Haiti | 0.0 /100 | #327 | Tragic 8.4% |
| Yakama | 0.0 /100 | #328 | Tragic 8.4% |
| Hopi | 0.0 /100 | #329 | Tragic 8.5% |
| Inupiat | 0.0 /100 | #330 | Tragic 8.5% |
| Sioux | 0.0 /100 | #331 | Tragic 8.5% |
| U.S. Virgin Islanders | 0.0 /100 | #332 | Tragic 8.6% |
Demographics Similar to Palestinians by Single Mother Households
In terms of single mother households, the demographic groups most similar to Palestinians are Immigrants from Bolivia (5.9%, a difference of 0.030%), Czechoslovakian (5.9%, a difference of 0.040%), Lebanese (5.9%, a difference of 0.12%), Welsh (5.9%, a difference of 0.30%), and Slavic (5.9%, a difference of 0.33%).
| Demographics | Rating | Rank | Single Mother Households |
| Immigrants | Uzbekistan | 93.4 /100 | #123 | Exceptional 5.9% |
| Immigrants | Argentina | 93.2 /100 | #124 | Exceptional 5.9% |
| Slavs | 92.9 /100 | #125 | Exceptional 5.9% |
| Welsh | 92.8 /100 | #126 | Exceptional 5.9% |
| Lebanese | 92.4 /100 | #127 | Exceptional 5.9% |
| Czechoslovakians | 92.2 /100 | #128 | Exceptional 5.9% |
| Immigrants | Bolivia | 92.2 /100 | #129 | Exceptional 5.9% |
| Palestinians | 92.1 /100 | #130 | Exceptional 5.9% |
| Immigrants | Spain | 91.2 /100 | #131 | Exceptional 5.9% |
| Albanians | 91.1 /100 | #132 | Exceptional 5.9% |
| Egyptians | 90.7 /100 | #133 | Exceptional 5.9% |
| Canadians | 90.5 /100 | #134 | Exceptional 5.9% |
| Immigrants | Saudi Arabia | 90.2 /100 | #135 | Exceptional 5.9% |
| Jordanians | 88.9 /100 | #136 | Excellent 6.0% |
| Immigrants | Pakistan | 88.4 /100 | #137 | Excellent 6.0% |