Immigrants from Central America vs Palestinian Single Mother Households
COMPARE
Immigrants from Central America
Palestinian
Single Mother Households
Single Mother Households Comparison
Immigrants from Central America
Palestinians
8.1%
SINGLE MOTHER HOUSEHOLDS
0.0/ 100
METRIC RATING
308th/ 347
METRIC RANK
5.9%
SINGLE MOTHER HOUSEHOLDS
92.1/ 100
METRIC RATING
130th/ 347
METRIC RANK
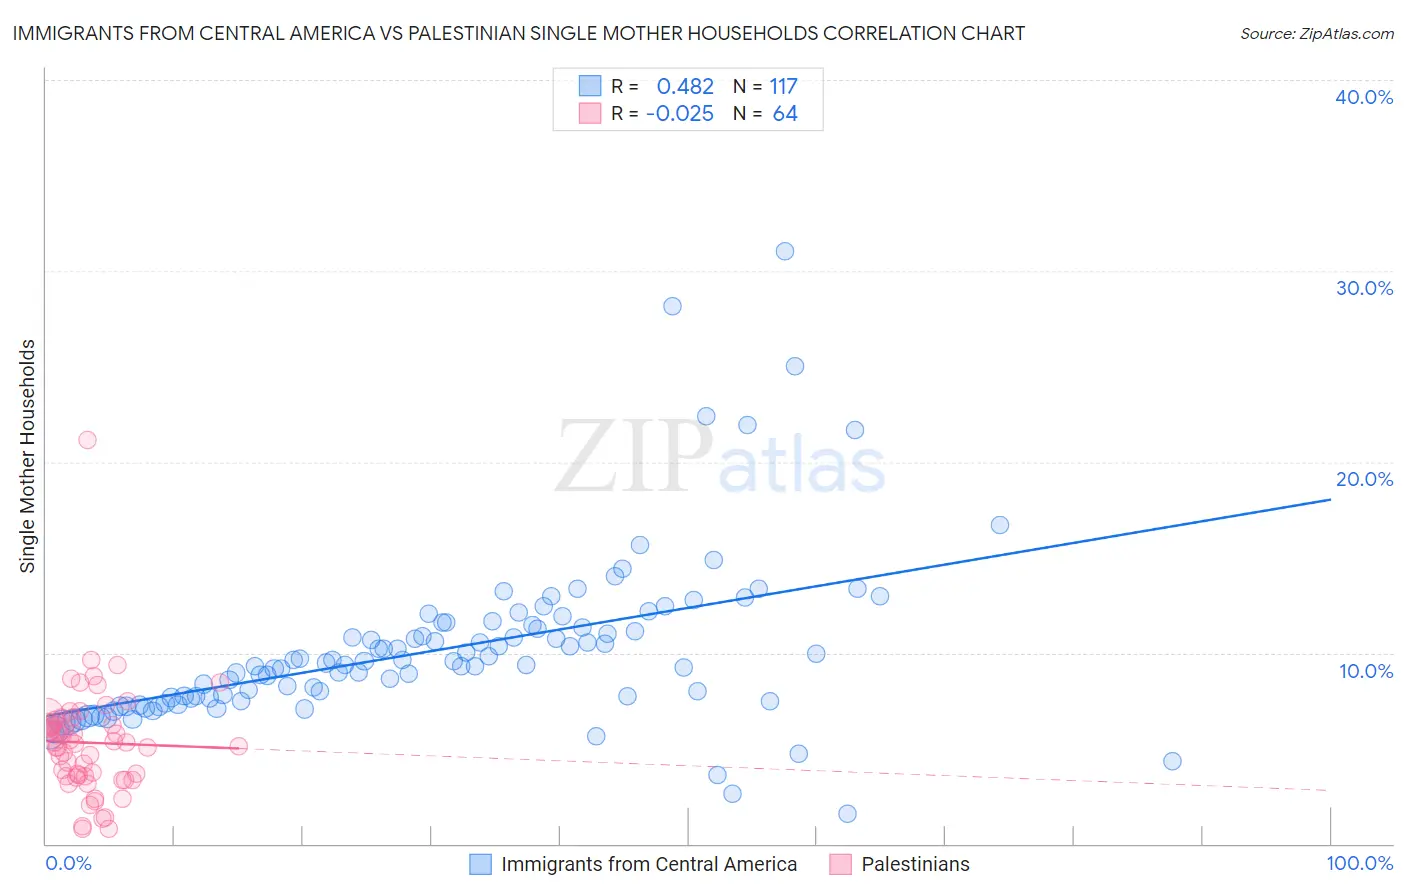
Immigrants from Central America vs Palestinian Single Mother Households Correlation Chart
The statistical analysis conducted on geographies consisting of 533,472,888 people shows a moderate positive correlation between the proportion of Immigrants from Central America and percentage of single mother households in the United States with a correlation coefficient (R) of 0.482 and weighted average of 8.1%. Similarly, the statistical analysis conducted on geographies consisting of 216,255,094 people shows no correlation between the proportion of Palestinians and percentage of single mother households in the United States with a correlation coefficient (R) of -0.025 and weighted average of 5.9%, a difference of 36.8%.
Single Mother Households Correlation Summary
| Measurement | Immigrants from Central America | Palestinian |
| Minimum | 1.6% | 0.78% |
| Maximum | 31.0% | 21.1% |
| Range | 29.5% | 20.3% |
| Mean | 10.1% | 5.3% |
| Median | 9.4% | 5.3% |
| Interquartile 25% (IQ1) | 7.5% | 3.5% |
| Interquartile 75% (IQ3) | 11.4% | 6.4% |
| Interquartile Range (IQR) | 3.9% | 2.8% |
| Standard Deviation (Sample) | 4.4% | 2.9% |
| Standard Deviation (Population) | 4.4% | 2.9% |
Similar Demographics by Single Mother Households
Demographics Similar to Immigrants from Central America by Single Mother Households
In terms of single mother households, the demographic groups most similar to Immigrants from Central America are Immigrants from St. Vincent and the Grenadines (8.0%, a difference of 0.020%), Immigrants from Barbados (8.0%, a difference of 0.26%), Colville (8.0%, a difference of 0.33%), Native/Alaskan (8.0%, a difference of 0.38%), and Cheyenne (8.1%, a difference of 0.44%).
| Demographics | Rating | Rank | Single Mother Households |
| Chippewa | 0.0 /100 | #301 | Tragic 8.0% |
| Immigrants | Ghana | 0.0 /100 | #302 | Tragic 8.0% |
| Immigrants | Bahamas | 0.0 /100 | #303 | Tragic 8.0% |
| Natives/Alaskans | 0.0 /100 | #304 | Tragic 8.0% |
| Colville | 0.0 /100 | #305 | Tragic 8.0% |
| Immigrants | Barbados | 0.0 /100 | #306 | Tragic 8.0% |
| Immigrants | St. Vincent and the Grenadines | 0.0 /100 | #307 | Tragic 8.0% |
| Immigrants | Central America | 0.0 /100 | #308 | Tragic 8.1% |
| Cheyenne | 0.0 /100 | #309 | Tragic 8.1% |
| Hondurans | 0.0 /100 | #310 | Tragic 8.1% |
| Immigrants | Congo | 0.0 /100 | #311 | Tragic 8.1% |
| Bangladeshis | 0.0 /100 | #312 | Tragic 8.1% |
| Immigrants | Grenada | 0.0 /100 | #313 | Tragic 8.2% |
| Immigrants | Mexico | 0.0 /100 | #314 | Tragic 8.2% |
| Immigrants | Western Africa | 0.0 /100 | #315 | Tragic 8.2% |
Demographics Similar to Palestinians by Single Mother Households
In terms of single mother households, the demographic groups most similar to Palestinians are Immigrants from Bolivia (5.9%, a difference of 0.030%), Czechoslovakian (5.9%, a difference of 0.040%), Lebanese (5.9%, a difference of 0.12%), Welsh (5.9%, a difference of 0.30%), and Slavic (5.9%, a difference of 0.33%).
| Demographics | Rating | Rank | Single Mother Households |
| Immigrants | Uzbekistan | 93.4 /100 | #123 | Exceptional 5.9% |
| Immigrants | Argentina | 93.2 /100 | #124 | Exceptional 5.9% |
| Slavs | 92.9 /100 | #125 | Exceptional 5.9% |
| Welsh | 92.8 /100 | #126 | Exceptional 5.9% |
| Lebanese | 92.4 /100 | #127 | Exceptional 5.9% |
| Czechoslovakians | 92.2 /100 | #128 | Exceptional 5.9% |
| Immigrants | Bolivia | 92.2 /100 | #129 | Exceptional 5.9% |
| Palestinians | 92.1 /100 | #130 | Exceptional 5.9% |
| Immigrants | Spain | 91.2 /100 | #131 | Exceptional 5.9% |
| Albanians | 91.1 /100 | #132 | Exceptional 5.9% |
| Egyptians | 90.7 /100 | #133 | Exceptional 5.9% |
| Canadians | 90.5 /100 | #134 | Exceptional 5.9% |
| Immigrants | Saudi Arabia | 90.2 /100 | #135 | Exceptional 5.9% |
| Jordanians | 88.9 /100 | #136 | Excellent 6.0% |
| Immigrants | Pakistan | 88.4 /100 | #137 | Excellent 6.0% |