Senegalese vs Nonimmigrants Single Mother Households
COMPARE
Senegalese
Nonimmigrants
Single Mother Households
Single Mother Households Comparison
Senegalese
Nonimmigrants
8.2%
SINGLE MOTHER HOUSEHOLDS
0.0/ 100
METRIC RATING
318th/ 347
METRIC RANK
6.7%
SINGLE MOTHER HOUSEHOLDS
10.4/ 100
METRIC RATING
210th/ 347
METRIC RANK
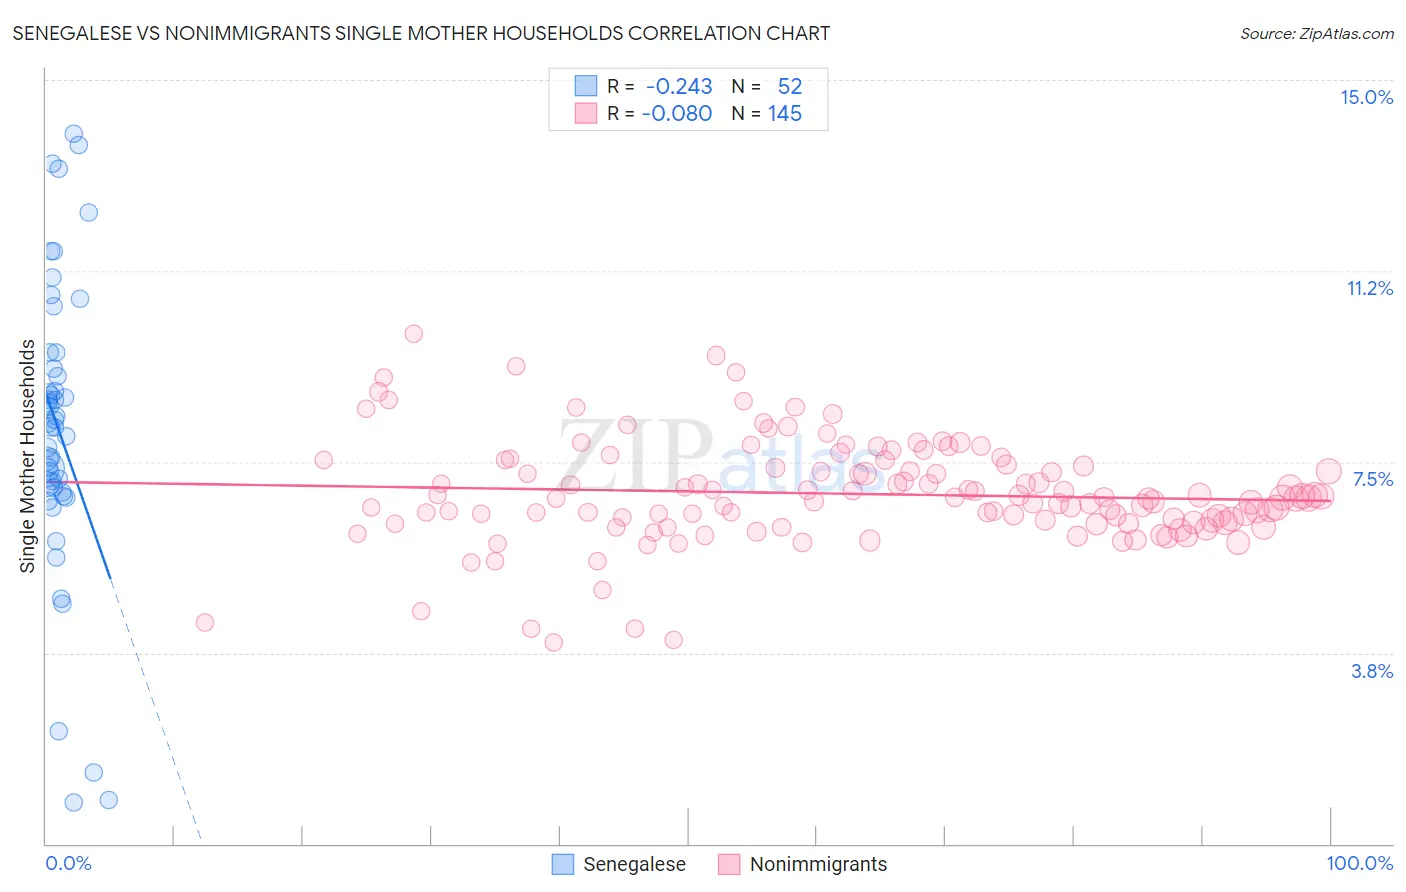
Senegalese vs Nonimmigrants Single Mother Households Correlation Chart
The statistical analysis conducted on geographies consisting of 78,081,080 people shows a weak negative correlation between the proportion of Senegalese and percentage of single mother households in the United States with a correlation coefficient (R) of -0.243 and weighted average of 8.2%. Similarly, the statistical analysis conducted on geographies consisting of 577,079,172 people shows a slight negative correlation between the proportion of Nonimmigrants and percentage of single mother households in the United States with a correlation coefficient (R) of -0.080 and weighted average of 6.7%, a difference of 23.2%.
Single Mother Households Correlation Summary
| Measurement | Senegalese | Nonimmigrants |
| Minimum | 0.81% | 4.0% |
| Maximum | 13.9% | 10.0% |
| Range | 13.1% | 6.1% |
| Mean | 8.2% | 6.9% |
| Median | 8.2% | 6.8% |
| Interquartile 25% (IQ1) | 6.9% | 6.3% |
| Interquartile 75% (IQ3) | 9.5% | 7.4% |
| Interquartile Range (IQR) | 2.5% | 1.1% |
| Standard Deviation (Sample) | 2.9% | 1.0% |
| Standard Deviation (Population) | 2.9% | 1.0% |
Similar Demographics by Single Mother Households
Demographics Similar to Senegalese by Single Mother Households
In terms of single mother households, the demographic groups most similar to Senegalese are Jamaican (8.2%, a difference of 0.11%), Bahamian (8.3%, a difference of 0.23%), Immigrants from Senegal (8.3%, a difference of 0.47%), Pima (8.3%, a difference of 0.55%), and Immigrants from Honduras (8.2%, a difference of 0.56%).
| Demographics | Rating | Rank | Single Mother Households |
| Immigrants | Congo | 0.0 /100 | #311 | Tragic 8.1% |
| Bangladeshis | 0.0 /100 | #312 | Tragic 8.1% |
| Immigrants | Grenada | 0.0 /100 | #313 | Tragic 8.2% |
| Immigrants | Mexico | 0.0 /100 | #314 | Tragic 8.2% |
| Immigrants | Western Africa | 0.0 /100 | #315 | Tragic 8.2% |
| Africans | 0.0 /100 | #316 | Tragic 8.2% |
| Immigrants | Honduras | 0.0 /100 | #317 | Tragic 8.2% |
| Senegalese | 0.0 /100 | #318 | Tragic 8.2% |
| Jamaicans | 0.0 /100 | #319 | Tragic 8.2% |
| Bahamians | 0.0 /100 | #320 | Tragic 8.3% |
| Immigrants | Senegal | 0.0 /100 | #321 | Tragic 8.3% |
| Pima | 0.0 /100 | #322 | Tragic 8.3% |
| Haitians | 0.0 /100 | #323 | Tragic 8.3% |
| Immigrants | Jamaica | 0.0 /100 | #324 | Tragic 8.4% |
| Immigrants | Caribbean | 0.0 /100 | #325 | Tragic 8.4% |
Demographics Similar to Nonimmigrants by Single Mother Households
In terms of single mother households, the demographic groups most similar to Nonimmigrants are Immigrants from Colombia (6.7%, a difference of 0.020%), Vietnamese (6.7%, a difference of 0.23%), German Russian (6.7%, a difference of 0.29%), Immigrants from South America (6.7%, a difference of 0.29%), and Cree (6.7%, a difference of 0.37%).
| Demographics | Rating | Rank | Single Mother Households |
| Immigrants | Peru | 12.0 /100 | #203 | Poor 6.7% |
| Immigrants | Fiji | 11.9 /100 | #204 | Poor 6.7% |
| Cree | 11.9 /100 | #205 | Poor 6.7% |
| German Russians | 11.5 /100 | #206 | Poor 6.7% |
| Immigrants | South America | 11.5 /100 | #207 | Poor 6.7% |
| Vietnamese | 11.3 /100 | #208 | Poor 6.7% |
| Immigrants | Colombia | 10.5 /100 | #209 | Poor 6.7% |
| Immigrants | Nonimmigrants | 10.4 /100 | #210 | Poor 6.7% |
| Immigrants | Venezuela | 8.5 /100 | #211 | Tragic 6.7% |
| Immigrants | Eritrea | 8.4 /100 | #212 | Tragic 6.7% |
| Immigrants | Costa Rica | 8.2 /100 | #213 | Tragic 6.7% |
| Immigrants | Uruguay | 7.9 /100 | #214 | Tragic 6.7% |
| Shoshone | 5.7 /100 | #215 | Tragic 6.8% |
| Cherokee | 5.1 /100 | #216 | Tragic 6.8% |
| Aleuts | 4.8 /100 | #217 | Tragic 6.8% |