Malaysian vs Palestinian Single Mother Households
COMPARE
Malaysian
Palestinian
Single Mother Households
Single Mother Households Comparison
Malaysians
Palestinians
7.3%
SINGLE MOTHER HOUSEHOLDS
0.3/ 100
METRIC RATING
251st/ 347
METRIC RANK
5.9%
SINGLE MOTHER HOUSEHOLDS
92.1/ 100
METRIC RATING
130th/ 347
METRIC RANK
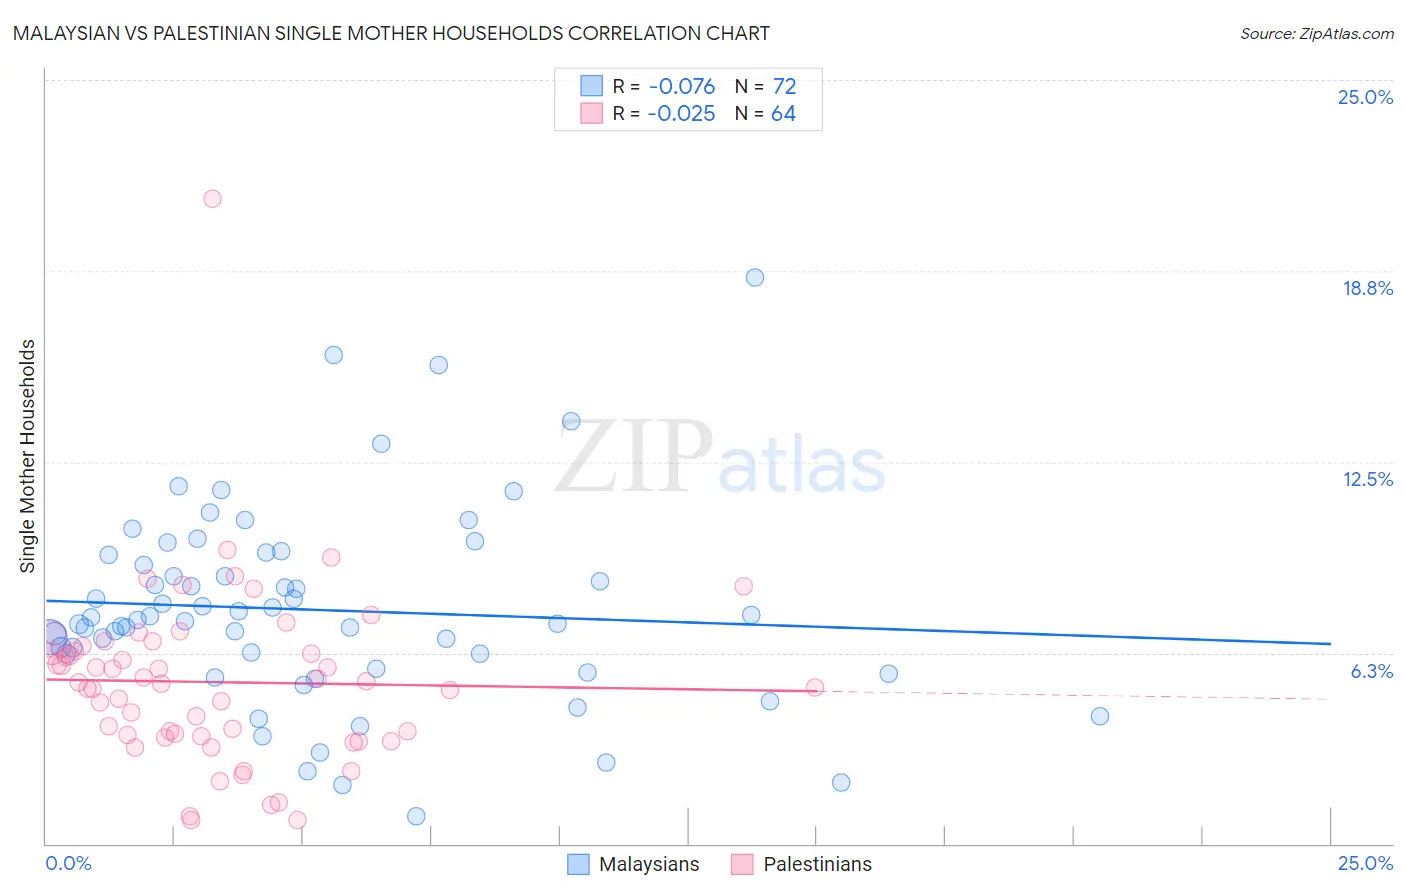
Malaysian vs Palestinian Single Mother Households Correlation Chart
The statistical analysis conducted on geographies consisting of 225,856,339 people shows a slight negative correlation between the proportion of Malaysians and percentage of single mother households in the United States with a correlation coefficient (R) of -0.076 and weighted average of 7.3%. Similarly, the statistical analysis conducted on geographies consisting of 216,255,094 people shows no correlation between the proportion of Palestinians and percentage of single mother households in the United States with a correlation coefficient (R) of -0.025 and weighted average of 5.9%, a difference of 24.1%.
Single Mother Households Correlation Summary
| Measurement | Malaysian | Palestinian |
| Minimum | 0.92% | 0.78% |
| Maximum | 18.5% | 21.1% |
| Range | 17.6% | 20.3% |
| Mean | 7.7% | 5.3% |
| Median | 7.3% | 5.3% |
| Interquartile 25% (IQ1) | 6.0% | 3.5% |
| Interquartile 75% (IQ3) | 9.3% | 6.4% |
| Interquartile Range (IQR) | 3.3% | 2.8% |
| Standard Deviation (Sample) | 3.2% | 2.9% |
| Standard Deviation (Population) | 3.2% | 2.9% |
Similar Demographics by Single Mother Households
Demographics Similar to Malaysians by Single Mother Households
In terms of single mother households, the demographic groups most similar to Malaysians are Alaskan Athabascan (7.3%, a difference of 0.020%), Immigrants from Africa (7.3%, a difference of 0.34%), Bermudan (7.3%, a difference of 0.36%), Cajun (7.3%, a difference of 0.41%), and Immigrants from Ecuador (7.3%, a difference of 0.46%).
| Demographics | Rating | Rank | Single Mother Households |
| Cubans | 0.6 /100 | #244 | Tragic 7.2% |
| Immigrants | Cambodia | 0.5 /100 | #245 | Tragic 7.2% |
| Nicaraguans | 0.5 /100 | #246 | Tragic 7.2% |
| Dutch West Indians | 0.4 /100 | #247 | Tragic 7.3% |
| Spanish American Indians | 0.4 /100 | #248 | Tragic 7.3% |
| Bermudans | 0.4 /100 | #249 | Tragic 7.3% |
| Immigrants | Africa | 0.4 /100 | #250 | Tragic 7.3% |
| Malaysians | 0.3 /100 | #251 | Tragic 7.3% |
| Alaskan Athabascans | 0.3 /100 | #252 | Tragic 7.3% |
| Cajuns | 0.3 /100 | #253 | Tragic 7.3% |
| Immigrants | Ecuador | 0.3 /100 | #254 | Tragic 7.3% |
| Mexican American Indians | 0.2 /100 | #255 | Tragic 7.4% |
| Seminole | 0.2 /100 | #256 | Tragic 7.4% |
| Alaska Natives | 0.2 /100 | #257 | Tragic 7.4% |
| Pueblo | 0.2 /100 | #258 | Tragic 7.4% |
Demographics Similar to Palestinians by Single Mother Households
In terms of single mother households, the demographic groups most similar to Palestinians are Immigrants from Bolivia (5.9%, a difference of 0.030%), Czechoslovakian (5.9%, a difference of 0.040%), Lebanese (5.9%, a difference of 0.12%), Welsh (5.9%, a difference of 0.30%), and Slavic (5.9%, a difference of 0.33%).
| Demographics | Rating | Rank | Single Mother Households |
| Immigrants | Uzbekistan | 93.4 /100 | #123 | Exceptional 5.9% |
| Immigrants | Argentina | 93.2 /100 | #124 | Exceptional 5.9% |
| Slavs | 92.9 /100 | #125 | Exceptional 5.9% |
| Welsh | 92.8 /100 | #126 | Exceptional 5.9% |
| Lebanese | 92.4 /100 | #127 | Exceptional 5.9% |
| Czechoslovakians | 92.2 /100 | #128 | Exceptional 5.9% |
| Immigrants | Bolivia | 92.2 /100 | #129 | Exceptional 5.9% |
| Palestinians | 92.1 /100 | #130 | Exceptional 5.9% |
| Immigrants | Spain | 91.2 /100 | #131 | Exceptional 5.9% |
| Albanians | 91.1 /100 | #132 | Exceptional 5.9% |
| Egyptians | 90.7 /100 | #133 | Exceptional 5.9% |
| Canadians | 90.5 /100 | #134 | Exceptional 5.9% |
| Immigrants | Saudi Arabia | 90.2 /100 | #135 | Exceptional 5.9% |
| Jordanians | 88.9 /100 | #136 | Excellent 6.0% |
| Immigrants | Pakistan | 88.4 /100 | #137 | Excellent 6.0% |