Senegalese vs Houma Single Mother Households
COMPARE
Senegalese
Houma
Single Mother Households
Single Mother Households Comparison
Senegalese
Houma
8.2%
SINGLE MOTHER HOUSEHOLDS
0.0/ 100
METRIC RATING
318th/ 347
METRIC RANK
7.9%
SINGLE MOTHER HOUSEHOLDS
0.0/ 100
METRIC RATING
299th/ 347
METRIC RANK
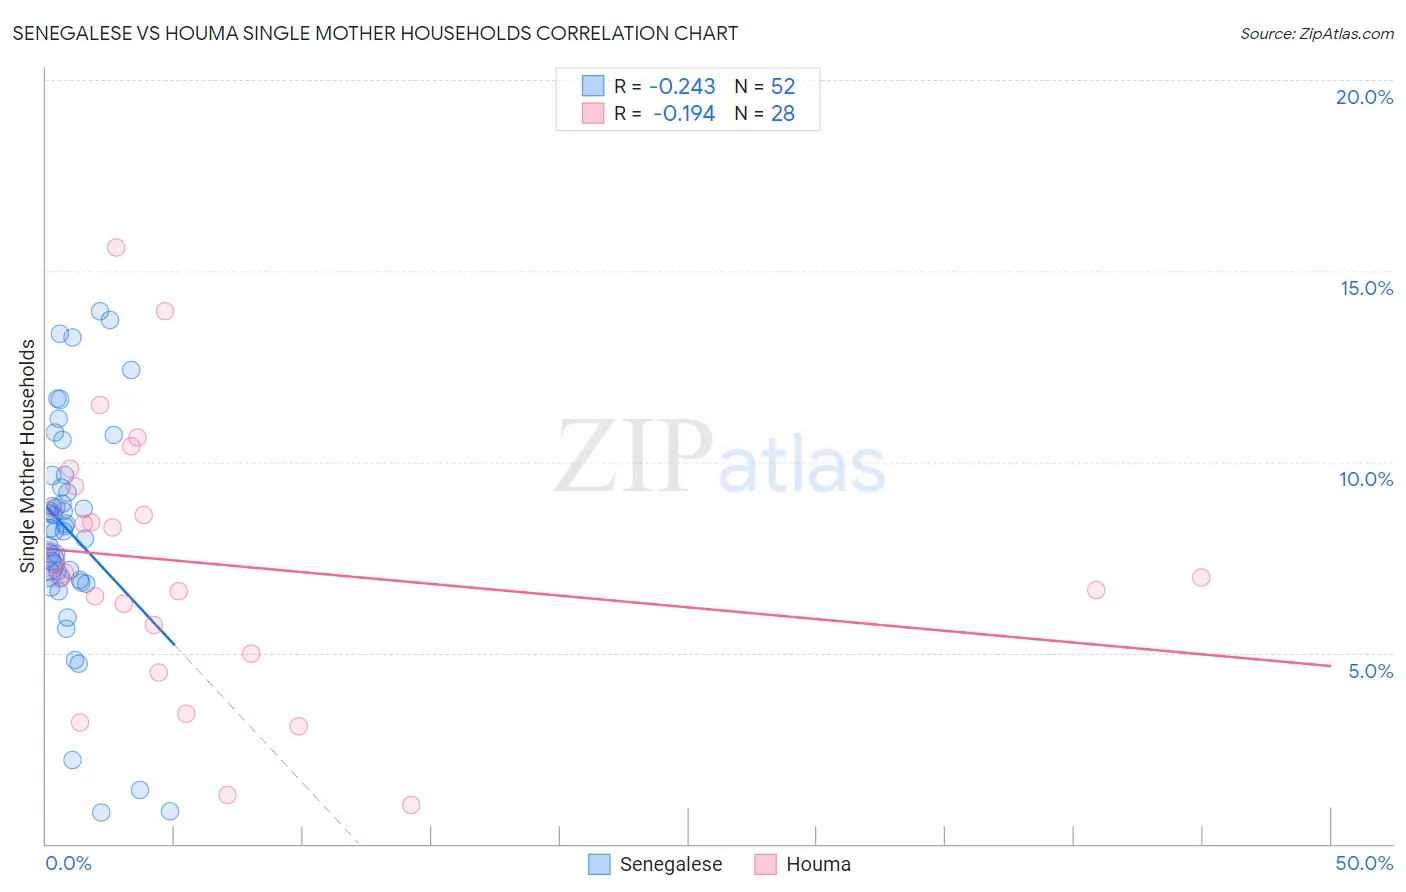
Senegalese vs Houma Single Mother Households Correlation Chart
The statistical analysis conducted on geographies consisting of 78,081,080 people shows a weak negative correlation between the proportion of Senegalese and percentage of single mother households in the United States with a correlation coefficient (R) of -0.243 and weighted average of 8.2%. Similarly, the statistical analysis conducted on geographies consisting of 36,776,416 people shows a poor negative correlation between the proportion of Houma and percentage of single mother households in the United States with a correlation coefficient (R) of -0.194 and weighted average of 7.9%, a difference of 3.9%.
Single Mother Households Correlation Summary
| Measurement | Senegalese | Houma |
| Minimum | 0.81% | 1.0% |
| Maximum | 13.9% | 15.6% |
| Range | 13.1% | 14.6% |
| Mean | 8.2% | 7.3% |
| Median | 8.2% | 7.0% |
| Interquartile 25% (IQ1) | 6.9% | 5.4% |
| Interquartile 75% (IQ3) | 9.5% | 9.1% |
| Interquartile Range (IQR) | 2.5% | 3.7% |
| Standard Deviation (Sample) | 2.9% | 3.4% |
| Standard Deviation (Population) | 2.9% | 3.3% |
Demographics Similar to Senegalese and Houma by Single Mother Households
In terms of single mother households, the demographic groups most similar to Senegalese are Immigrants from Honduras (8.2%, a difference of 0.56%), African (8.2%, a difference of 0.70%), Immigrants from Western Africa (8.2%, a difference of 0.85%), Immigrants from Mexico (8.2%, a difference of 0.88%), and Immigrants from Grenada (8.2%, a difference of 1.0%). Similarly, the demographic groups most similar to Houma are Immigrants from West Indies (7.9%, a difference of 0.080%), Mexican (8.0%, a difference of 0.46%), Chippewa (8.0%, a difference of 0.62%), Immigrants from Ghana (8.0%, a difference of 0.72%), and Immigrants from Bahamas (8.0%, a difference of 0.74%).
| Demographics | Rating | Rank | Single Mother Households |
| Immigrants | West Indies | 0.0 /100 | #298 | Tragic 7.9% |
| Houma | 0.0 /100 | #299 | Tragic 7.9% |
| Mexicans | 0.0 /100 | #300 | Tragic 8.0% |
| Chippewa | 0.0 /100 | #301 | Tragic 8.0% |
| Immigrants | Ghana | 0.0 /100 | #302 | Tragic 8.0% |
| Immigrants | Bahamas | 0.0 /100 | #303 | Tragic 8.0% |
| Natives/Alaskans | 0.0 /100 | #304 | Tragic 8.0% |
| Colville | 0.0 /100 | #305 | Tragic 8.0% |
| Immigrants | Barbados | 0.0 /100 | #306 | Tragic 8.0% |
| Immigrants | St. Vincent and the Grenadines | 0.0 /100 | #307 | Tragic 8.0% |
| Immigrants | Central America | 0.0 /100 | #308 | Tragic 8.1% |
| Cheyenne | 0.0 /100 | #309 | Tragic 8.1% |
| Hondurans | 0.0 /100 | #310 | Tragic 8.1% |
| Immigrants | Congo | 0.0 /100 | #311 | Tragic 8.1% |
| Bangladeshis | 0.0 /100 | #312 | Tragic 8.1% |
| Immigrants | Grenada | 0.0 /100 | #313 | Tragic 8.2% |
| Immigrants | Mexico | 0.0 /100 | #314 | Tragic 8.2% |
| Immigrants | Western Africa | 0.0 /100 | #315 | Tragic 8.2% |
| Africans | 0.0 /100 | #316 | Tragic 8.2% |
| Immigrants | Honduras | 0.0 /100 | #317 | Tragic 8.2% |
| Senegalese | 0.0 /100 | #318 | Tragic 8.2% |